"Bang for your Buck!": Investigating Wage Bill Influence on Success in Football

Bang for Buck: Football Wage Bills and Club Success
Maximizing return on investment is a fundamental aim across many industries, and professional football is no exception. Clubs routinely allocate substantial sums to player salaries, which represent both their largest operating cost and their most essential on-field asset. At the same time, these significant commitments can create financial vulnerabilities, placing constraints on a club’s overall budget and long-term sustainability.
The Economics of Success
When it comes to on-pitch achievements, there is often a visible relationship between higher wage expenditure and the likelihood of better results. However, this article is not a rigorous, data-intensive study with sophisticated machine learning models. Instead, it provides a straightforward examination of whether and how increased spending on wages might translate into more points during a typical season. The objective is to offer a simple heuristic or rule of thumb, rather than an ironclad formula for guaranteeing success. After all, while a bigger budget can help attract talented players, it remains just one factor among many that contribute to a club’s overall performance.
Points as a Currency
In football, points serve as the ultimate measure of accomplishment. They determine a club’s position in the domestic league and open doors to prestigious European competitions, such as the UEFA Champions League and the Europa League both of which carry significant financial and reputational benefits. Accumulating points is doubly important for clubs aiming to remain financially robust and avoid the pitfalls of relegation, an outcome that has derailed the fortunes of many historically significant teams.
The Wage Bill Connection
Although a higher wage bill often suggests a stronger, more capable squad, it does not automatically translate into consistent victories. Various factors like player injuries, tactical decisions, team dynamics, and managerial changes can derail even the best-funded plans. Nevertheless, the historical record frequently underscores a clear link between clubs with substantial wage outlays and those that secure higher league positions and qualify for European competition. The challenge is determining whether this financial commitment yields a proportionate return in terms of points on the board.
Examining the Data
Taking a closer look at wage structures and on-field results allows clubs and observers to gauge how effectively financial resources are converted into performance. By comparing season-by-season salary expenditures against points accumulation, one can identify patterns suggesting whether increased spending does, in fact, correlate with greater success. This analysis provokes further questions about overspending, undervaluing talent, and whether certain clubs consistently outperform others in converting monetary investment into sporting gains. Ultimately, the hope is to provide club executives, coaches, and even players themselves with a practical perspective on managing wages, negotiating contracts, and striking the delicate balance between financial investment and competitive achievement
Methodology and Data Sources
The data for this analysis were drawn from publicly available club financial statements. Wage figures were adjusted for inflation using a standardized consumer price index to allow for fair season-to-season comparisons. The dataset spans a continuous period (e.g., from 2013 to 2025 for both the Premier League and Championship) to capture a sufficiently large range of club circumstances, including promotions, relegations, and mid-table stability. Although care was taken to verify these numbers, minor discrepancies in reported wages may exist due to confidential or undisclosed payments.
Models
Premier League
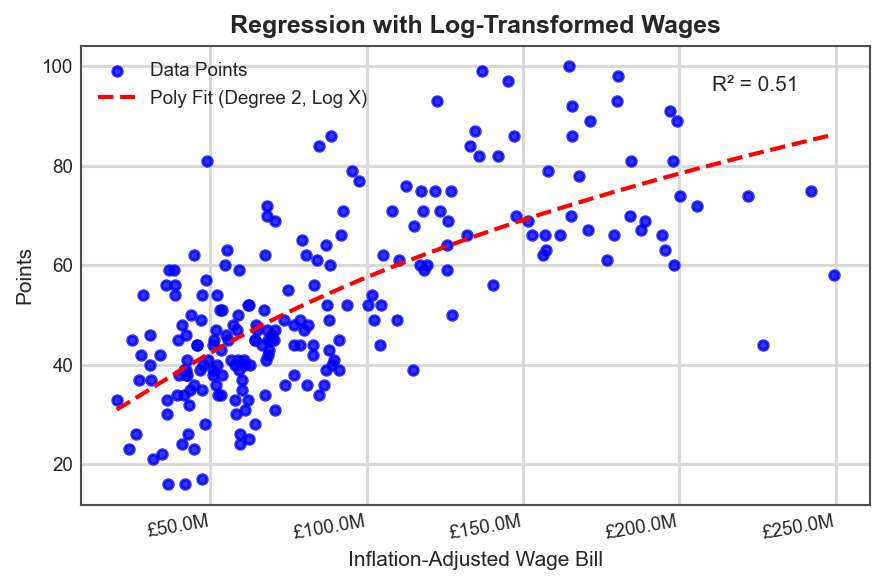
In analyzing the relationship between wages and points accumulation, I applied two polynomial-fitted regression models to log-transformed wages. The log transformation was necessary to address normality concerns and better capture the underlying trends in the data. A simple linear regression, in this case, would struggle to accurately represent the patterns observed, particularly given the apparent non-linearity in wage-to-points relationships. The Premier League chart, for instance, reveals a diminishing return on points accumulation as wage expenditure increases. This suggests that while increased spending on wages does contribute to performance, its impact plateaus at higher levels, making it a key consideration for stakeholders evaluating the efficiency of financial investments in squad salaries.
Championship
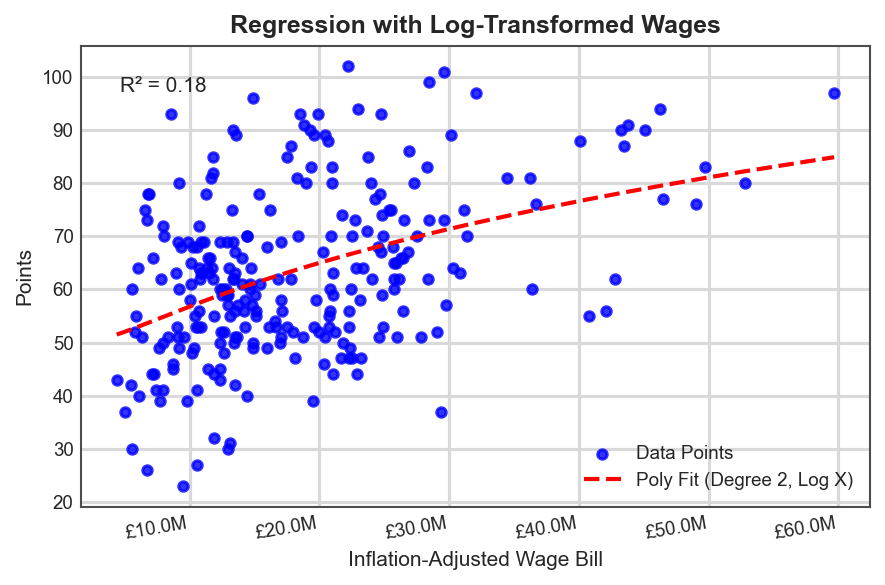
The Championship, however, presents a more ambiguous picture. Unlike the Premier League, where a clearer diminishing returns pattern emerges, the Championship’s wage-to-points relationship appears far weaker. Even with log-transformed wages and a non-linear regression fit, the correlation remains faint. This may be due to the tighter financial constraints within the league, where most clubs operate within a wage expenditure range of approximately £10 million to £60 million. Within this confined range, wage spending alone does not strongly dictate season outcomes. That being said, it would be naive to assume that dramatically exceeding this range pushing wage expenditure beyond £100 million would not have a direct impact on points accumulation. However, within the existing financial landscape of the Championship, wage spending appears to have only a weak influence on performance, highlighting the importance of other factors such as Player Quality, Squad Depth, tactical efficiency, squad cohesion, and managerial quality.
Data Transformations
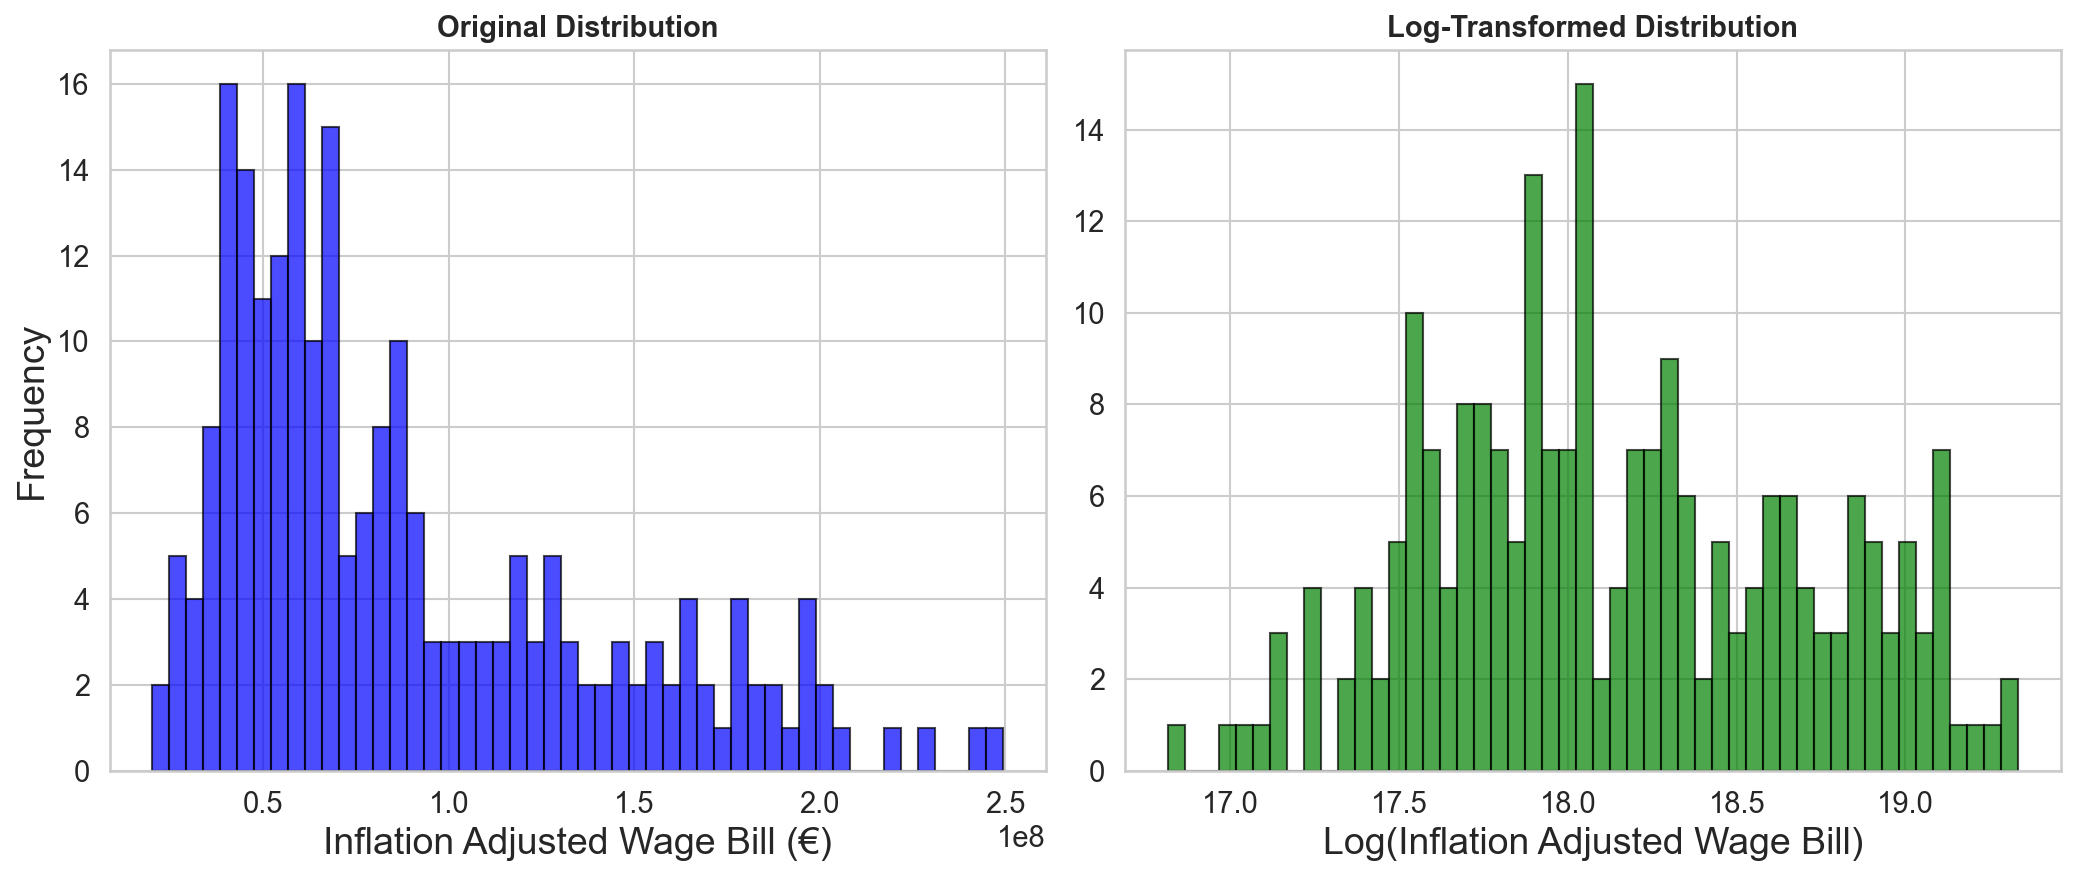
A common challenge when working with financial data particularly wage bills, which often vary by orders of magnitude is that the raw values tend to be skewed, with a long tail of very high observations. By applying a logarithmic transformation, we “compress” the scale of these larger values, bringing them closer in line with the rest of the data.
Concretely, there were two main reasons for log-transforming the wage bill data:
- Reducing Skewness
The raw wage data showed a right-skewed distribution, meaning a small number of extremely high wage bills pulled the mean upward. Log-transforming helps mitigate the effect of such extreme values, making the overall distribution more symmetric and reducing the influence of outliers. - Meeting Statistical Assumptions
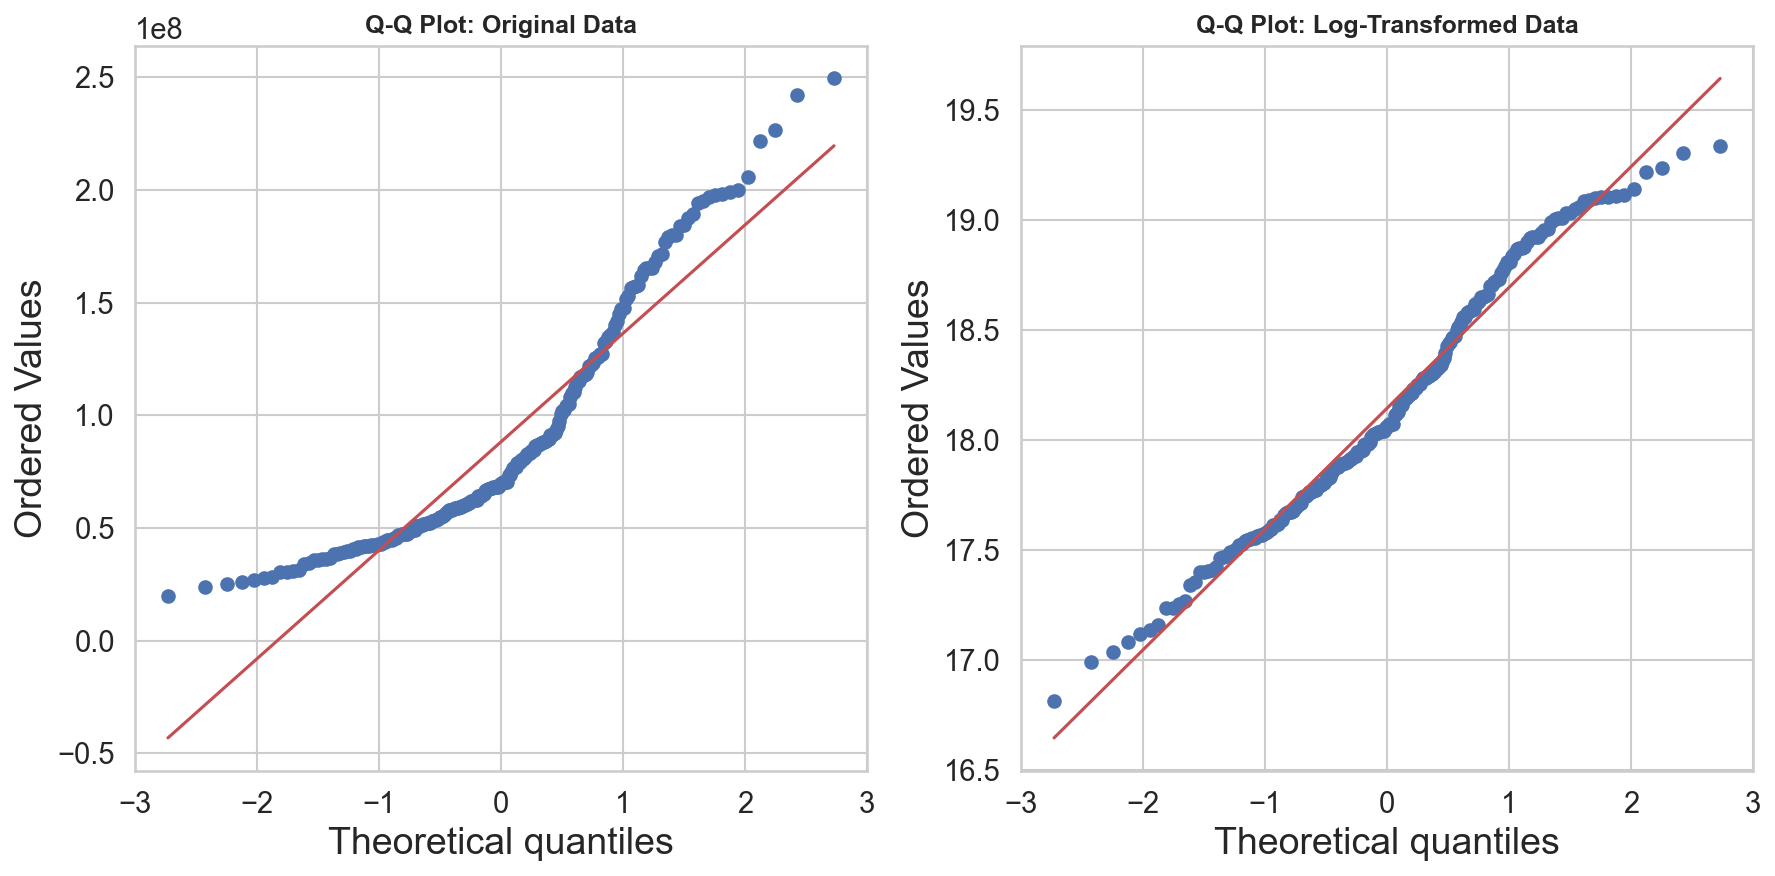
Many statistical techniques assume the data follows (or at least approximates) a normal distribution. To check whether the log transformation was effective, we compared histograms and used Q–Q plots before and after the transformation
In exploring the wage–points relationship, we tested multiple candidate models detailed above and subjected each to diagnostic checks such as residual plots, Q–Q plots, and cross-validation. Linear regression initially provided a simple baseline, but it often struggled to capture the diminishing returns that emerge with higher wage spending. By contrast, a small polynomial model effectively illustrated how incremental boosts in wages eventually yield progressively smaller performance gains. This combined approach methodical testing of multiple models, supported by robust diagnostics ultimately highlighted the model that best explains the wage–points dynamic while still offering practical, data-driven insights for club decision-makers
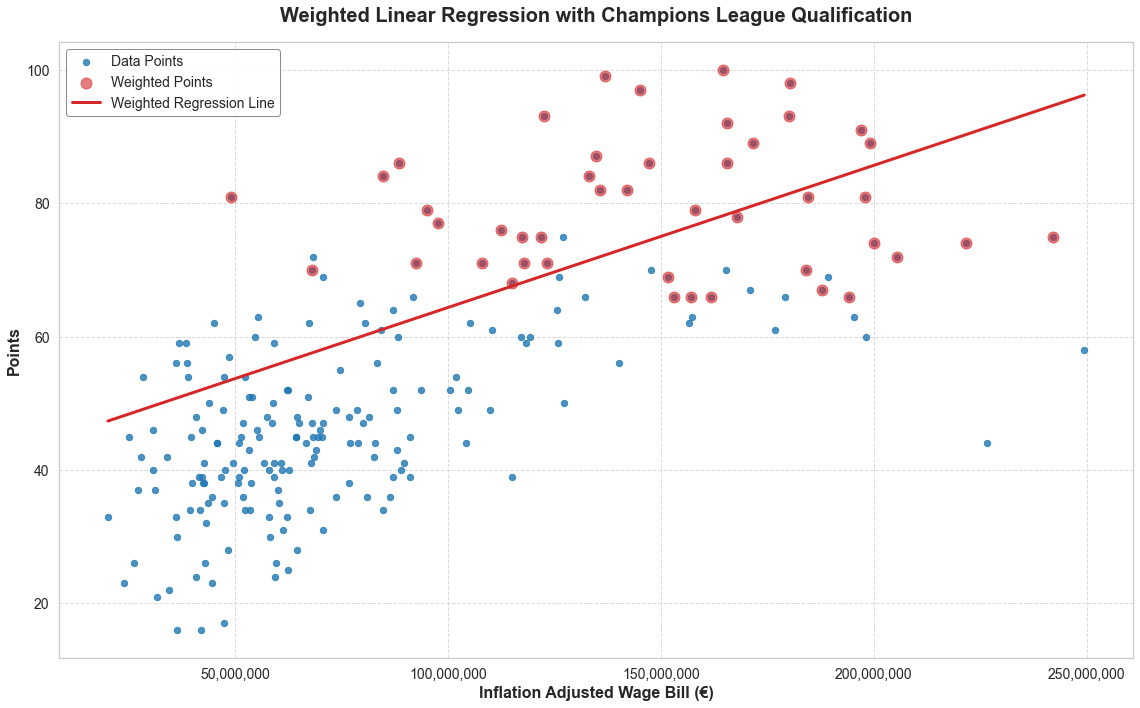
Exploring Other Models: In addition to the log-normal polynomial approach, we experimented with several alternative methods including standard linear regression, polynomial fits of varying degrees, local regression (LOESS), European Competition Weighted Regression and spline regression. Each method offers unique advantages; for instance, linear regression provides an easily interpretable measure of correlation, while spline fits can capture more nuanced, nonlinear patterns. However, these more flexible techniques may be prone to overfitting if not carefully managed. Ultimately, examining multiple approaches allowed us to confirm that our chosen model accurately reflected the wage–points relationship without unnecessary complexity. Readers interested in the technical details of these other approaches can contact us for more information. See example above
Predictions from Season (2023-2024)
Premier League
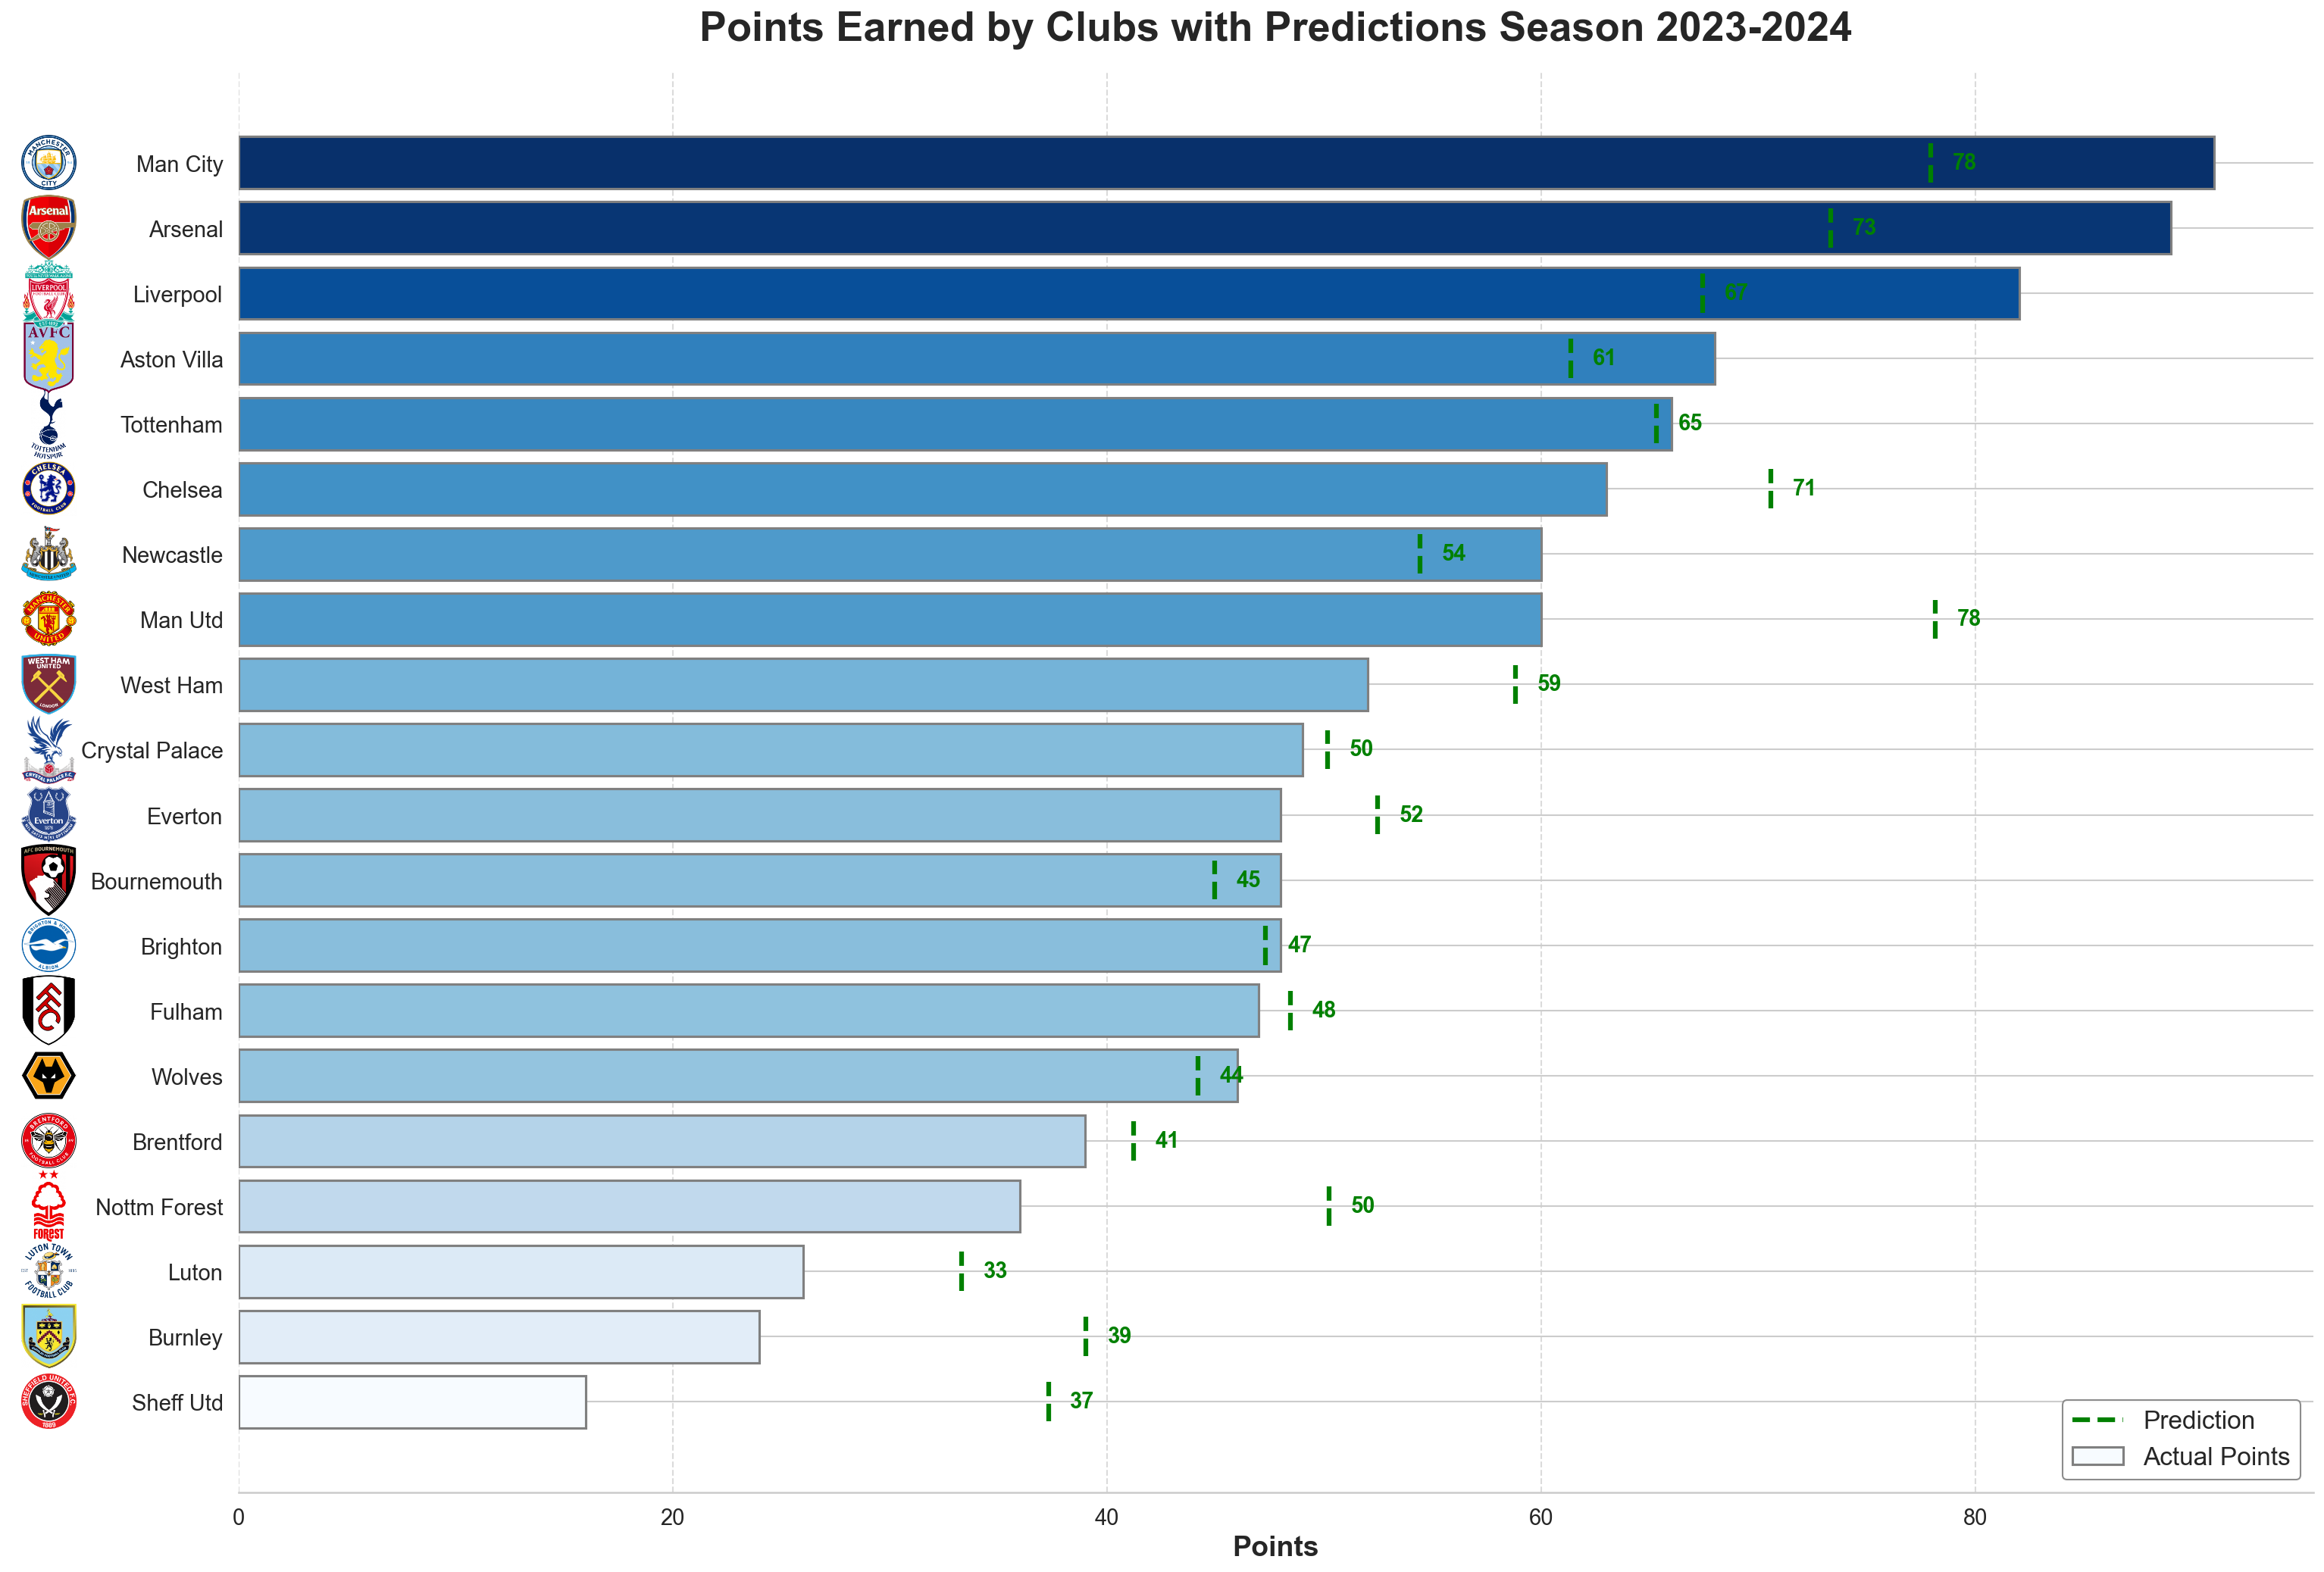
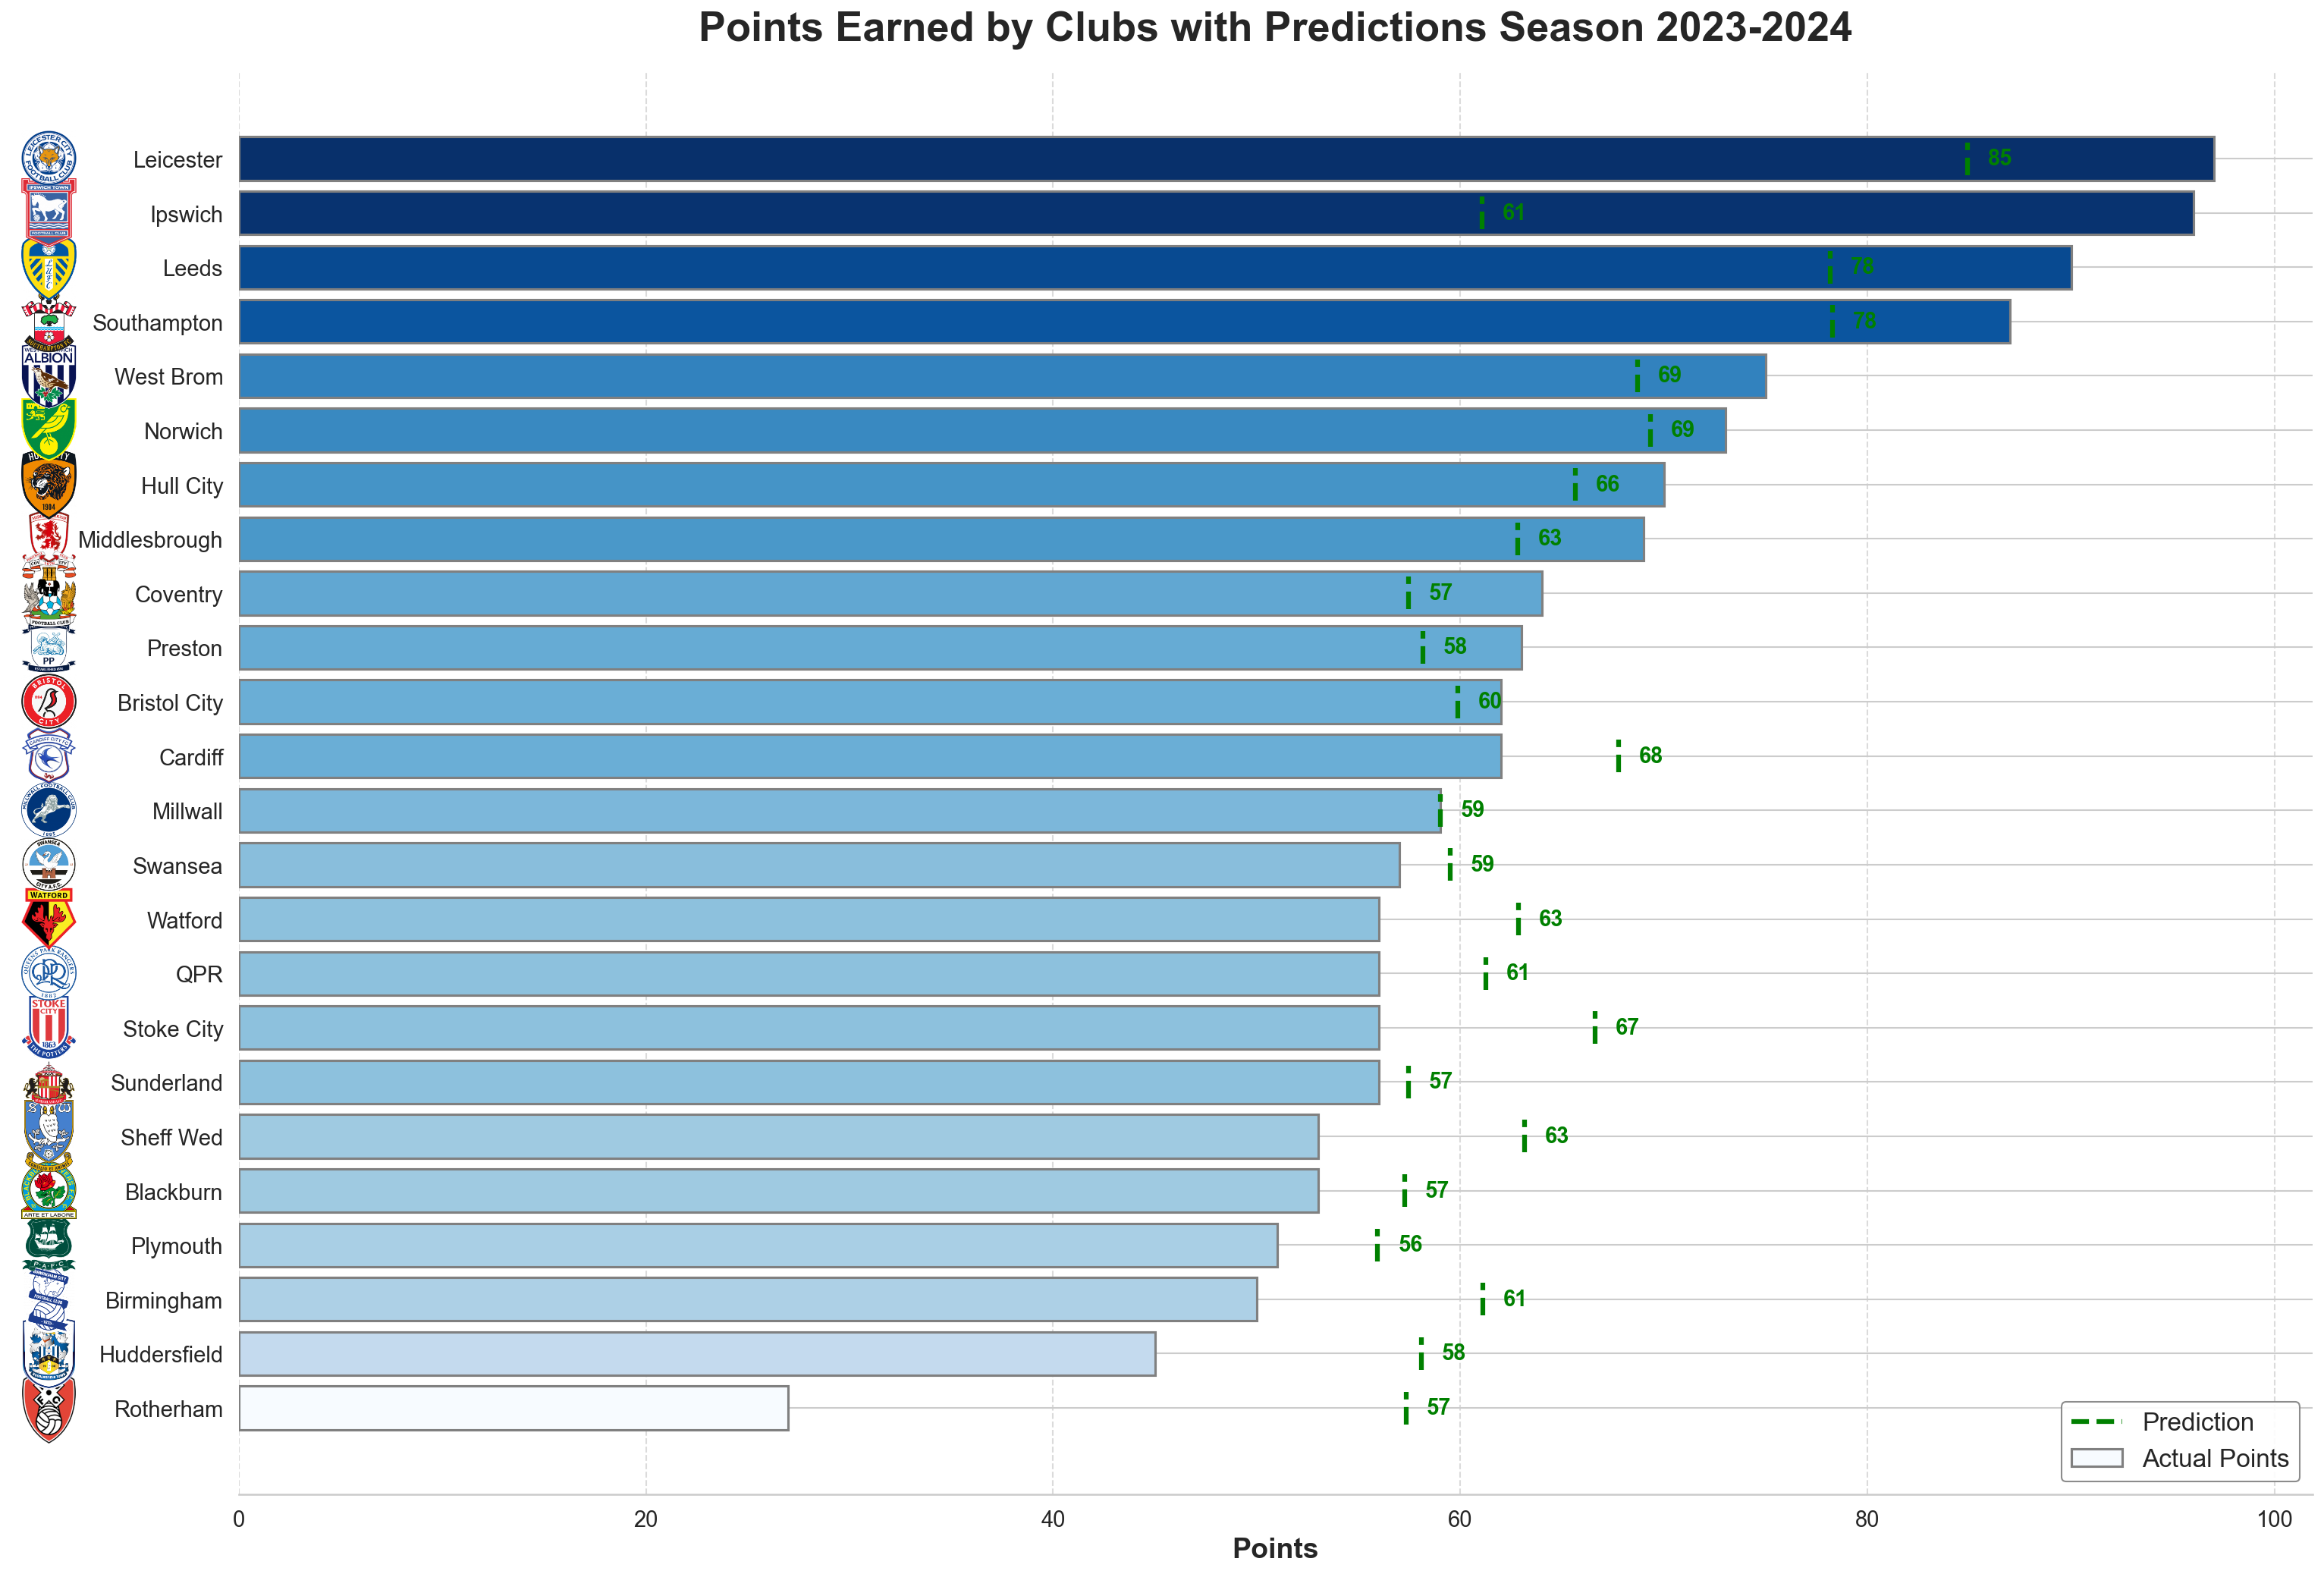
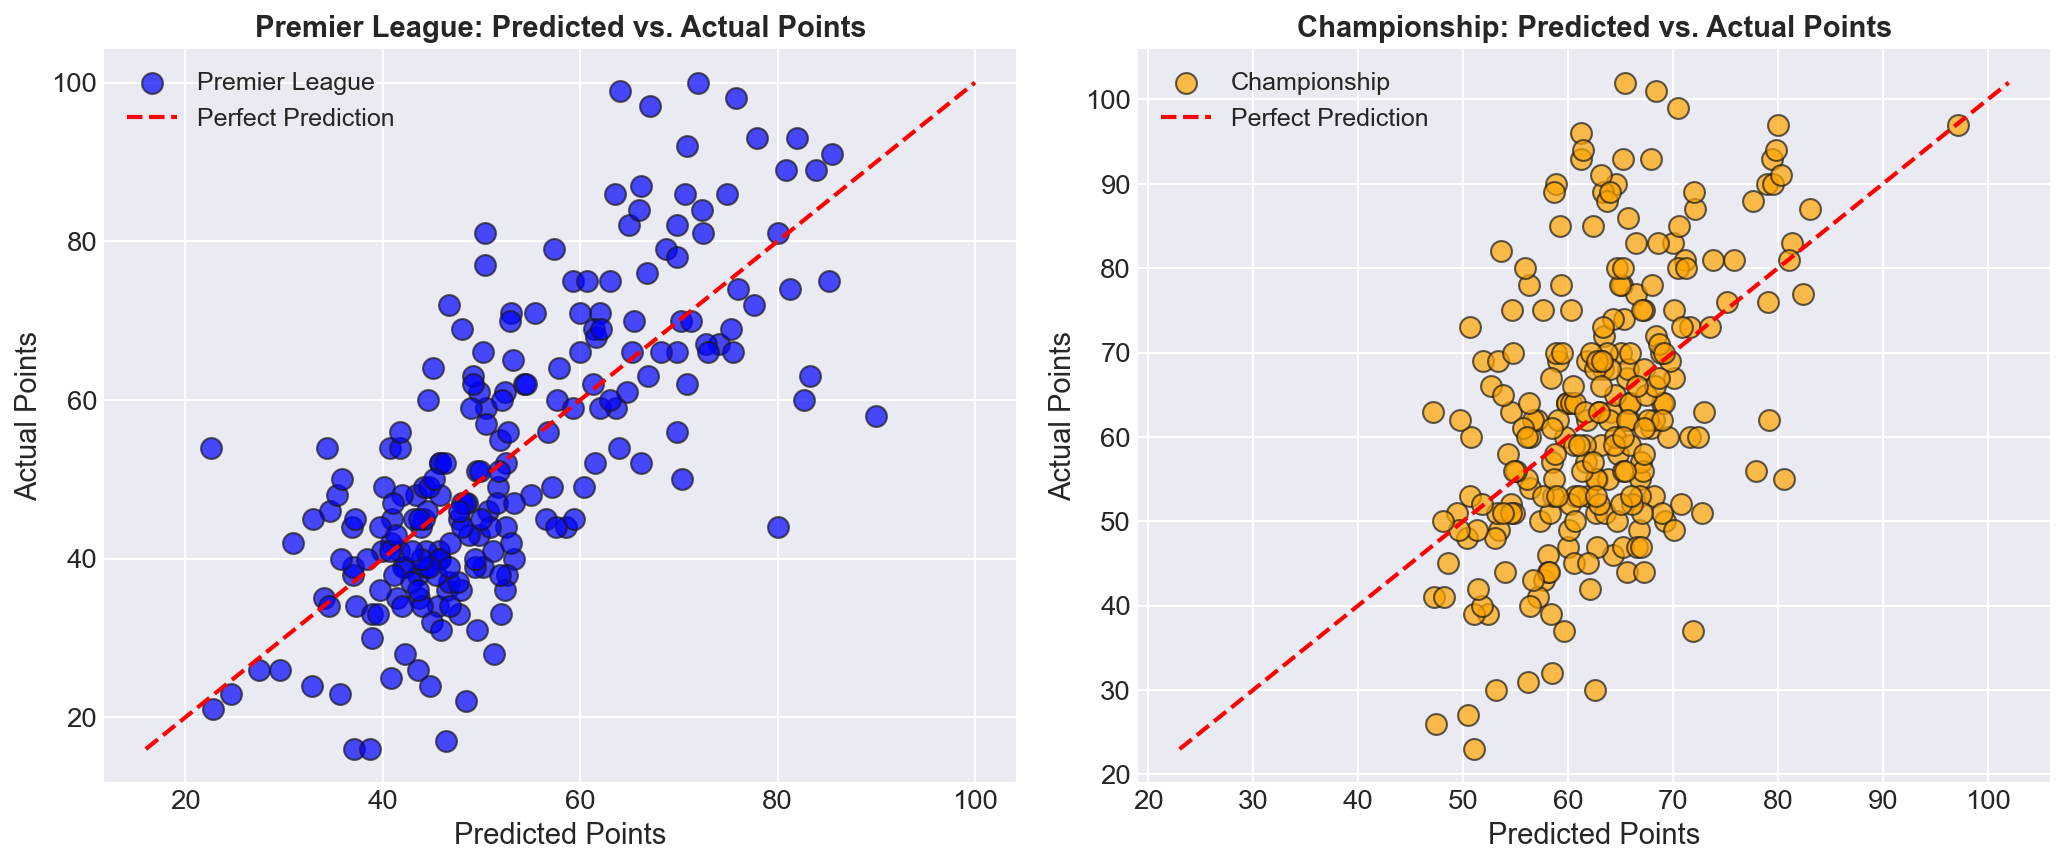
For the 2023-2024 season, we applied the polynomial regression fit to estimate the expected points for each club based on their wage expenditure in both the Premier League and the Championship. By comparing these predicted points to the actual points accumulated, we were able to assess which teams overperformed or underperformed relative to their wage spending. Naturally, no model is a perfect fit, but the Premier League demonstrates a stronger correlation between wages and performance, making the model's insights perhaps more 'reliable'. The Championship, on the other hand, exhibits greater variability, with a weaker correlation and a larger margin of error in its predictions. Despite these limitations, this model serves as a useful benchmark a crude but effective reference point. Clubs can use it to evaluate their wage expenditure against predicted performance, offering a simple way to gauge whether they are achieving a reasonable return on investment.
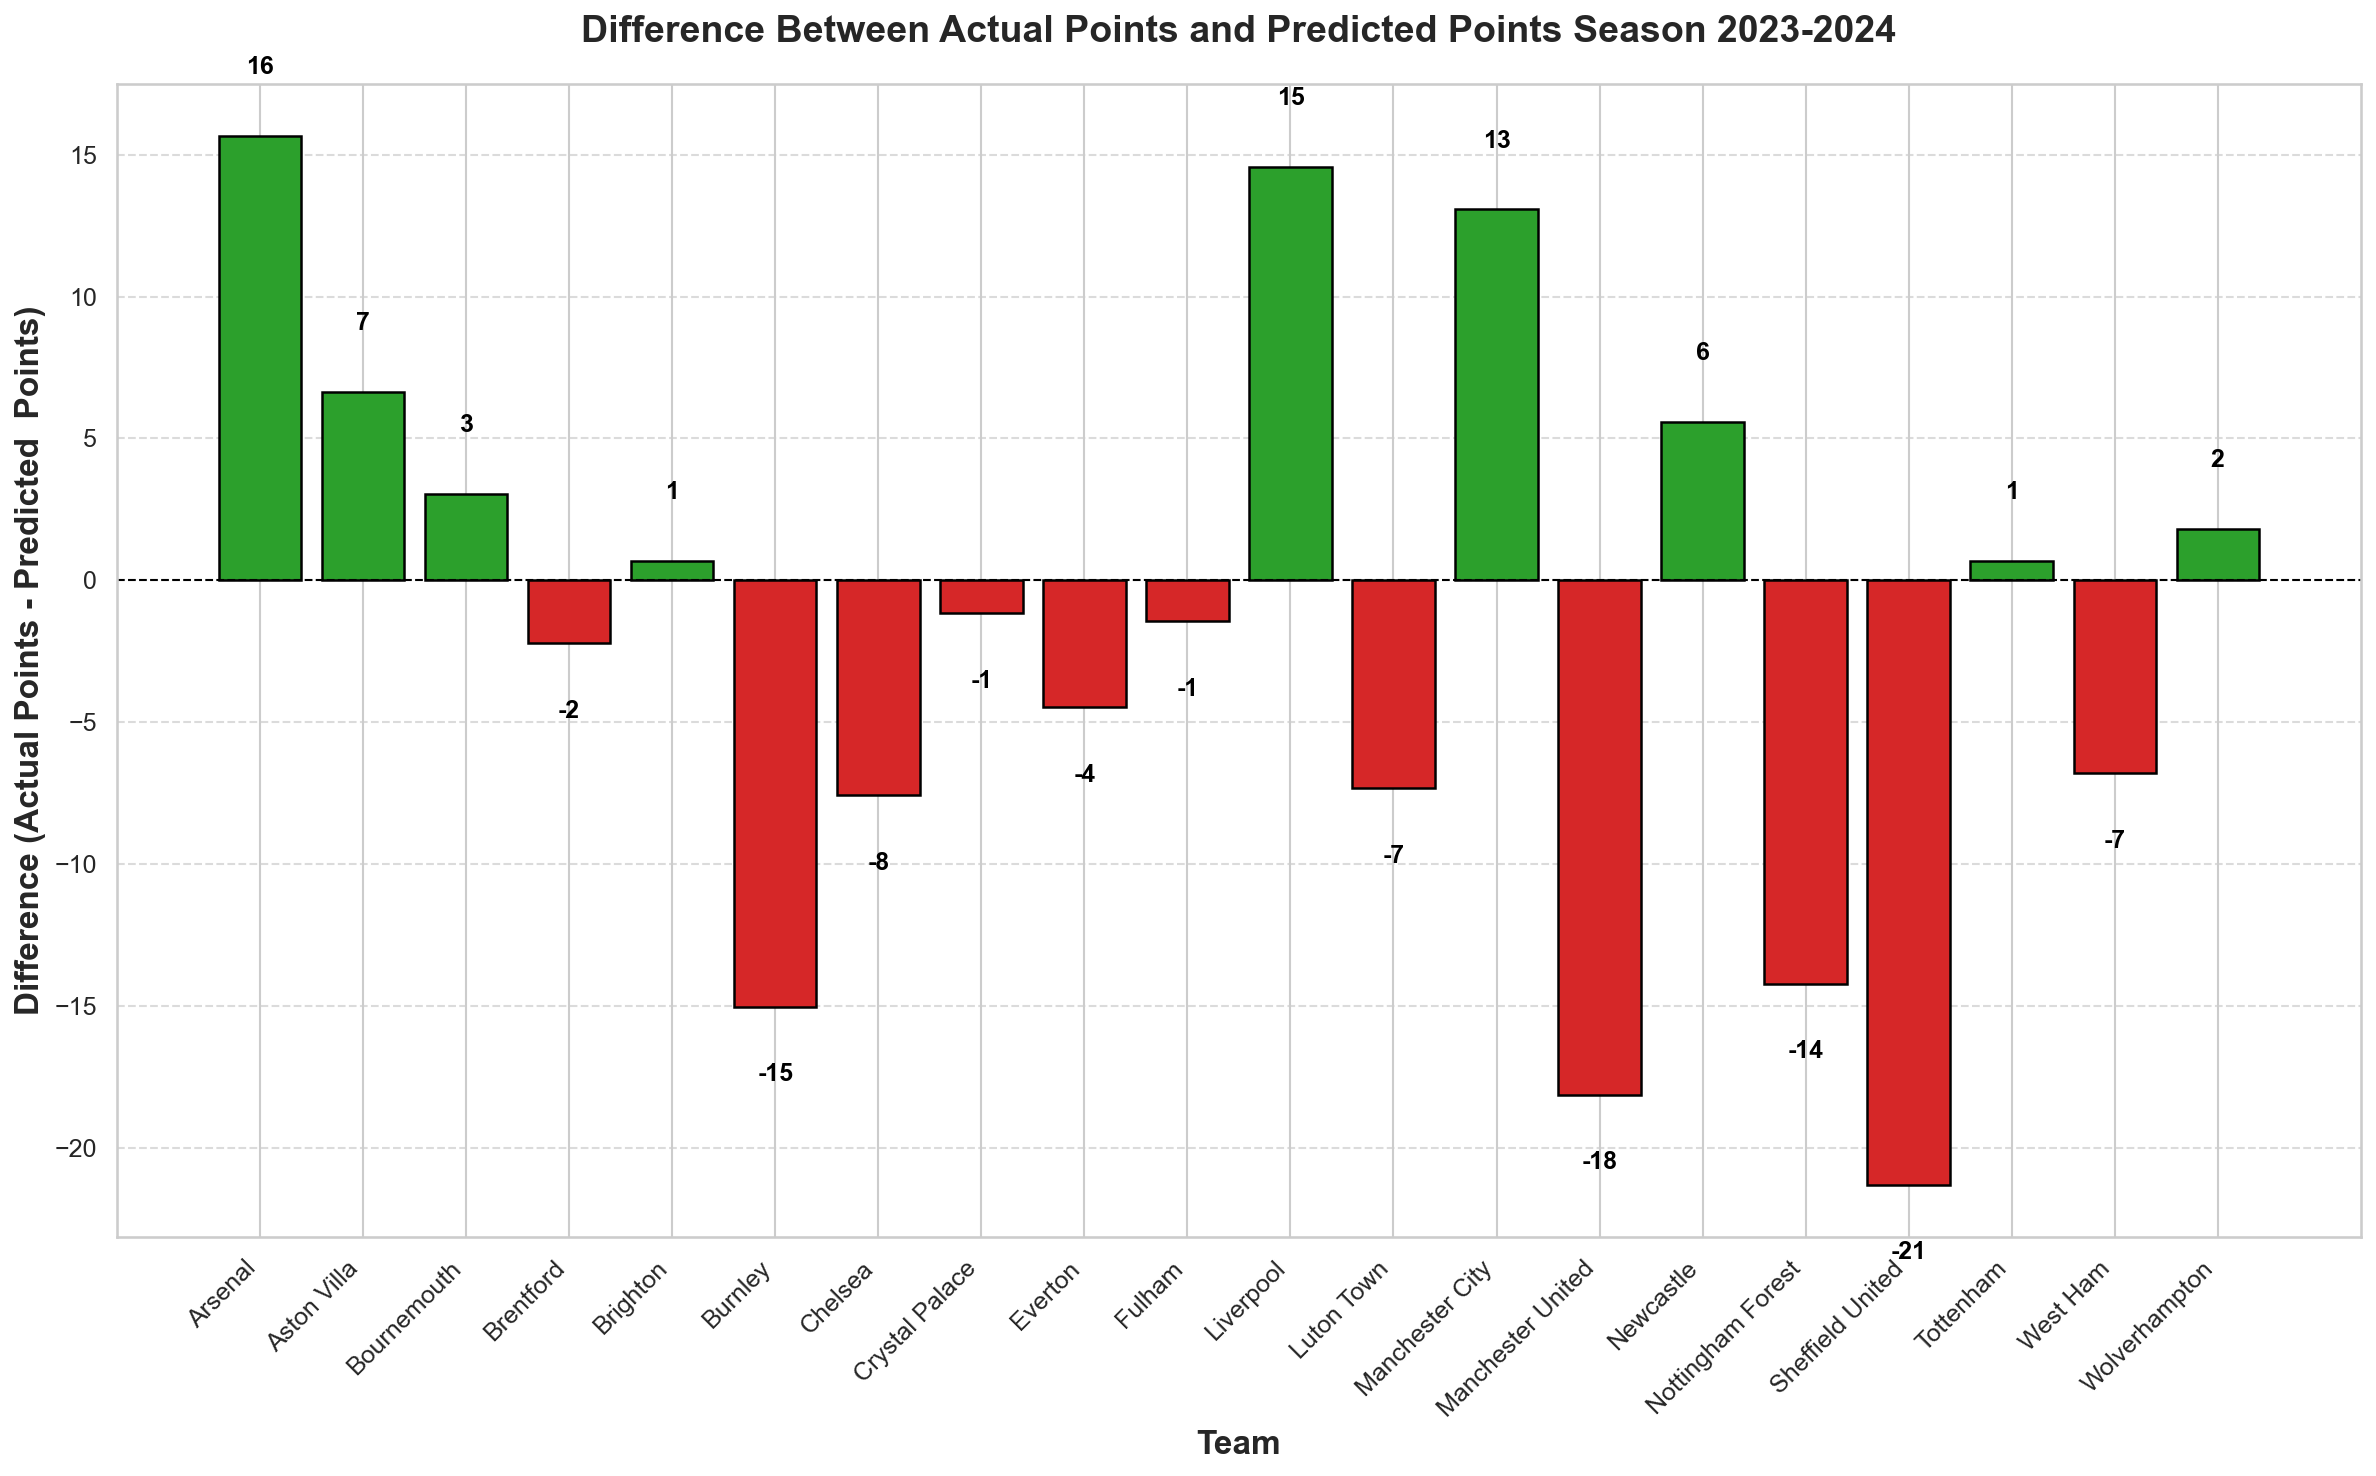
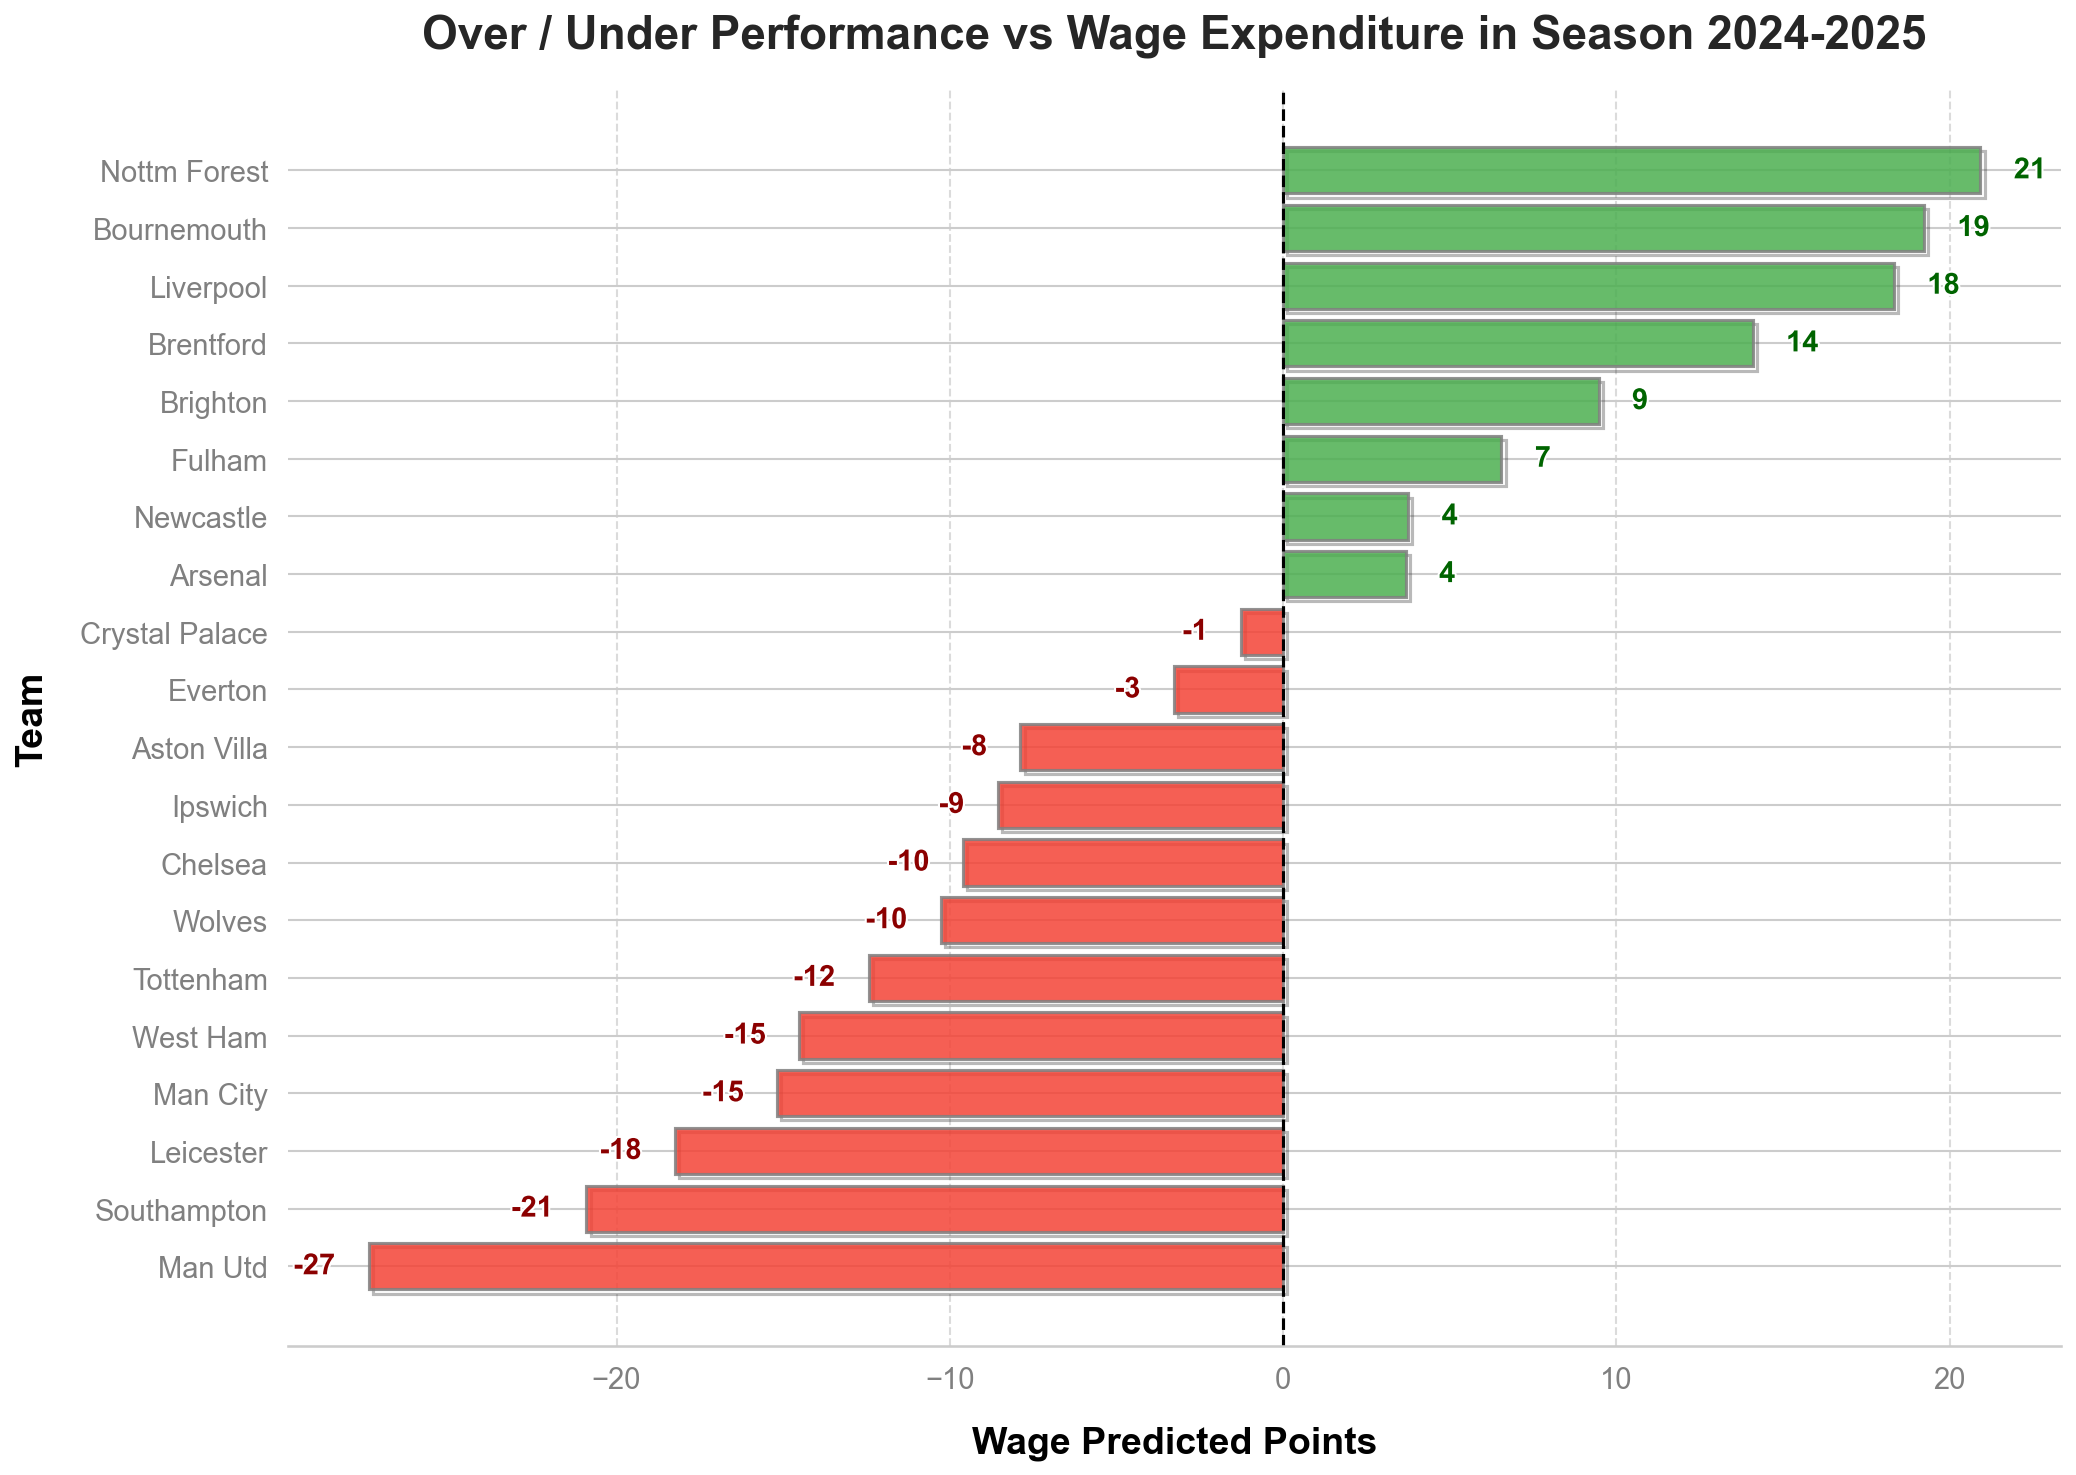
This bar chart depicts how each Premier League club’s actual points tally compares to the points predicted by the polynomial wage–points model, highlighting overperformance (green bars) or underperformance (red bars). Clubs shown with positive values have outperformed the model’s expectations. Conversely, negative values indicate clubs that have underperformed relative to their estimated outcomes.
Championship
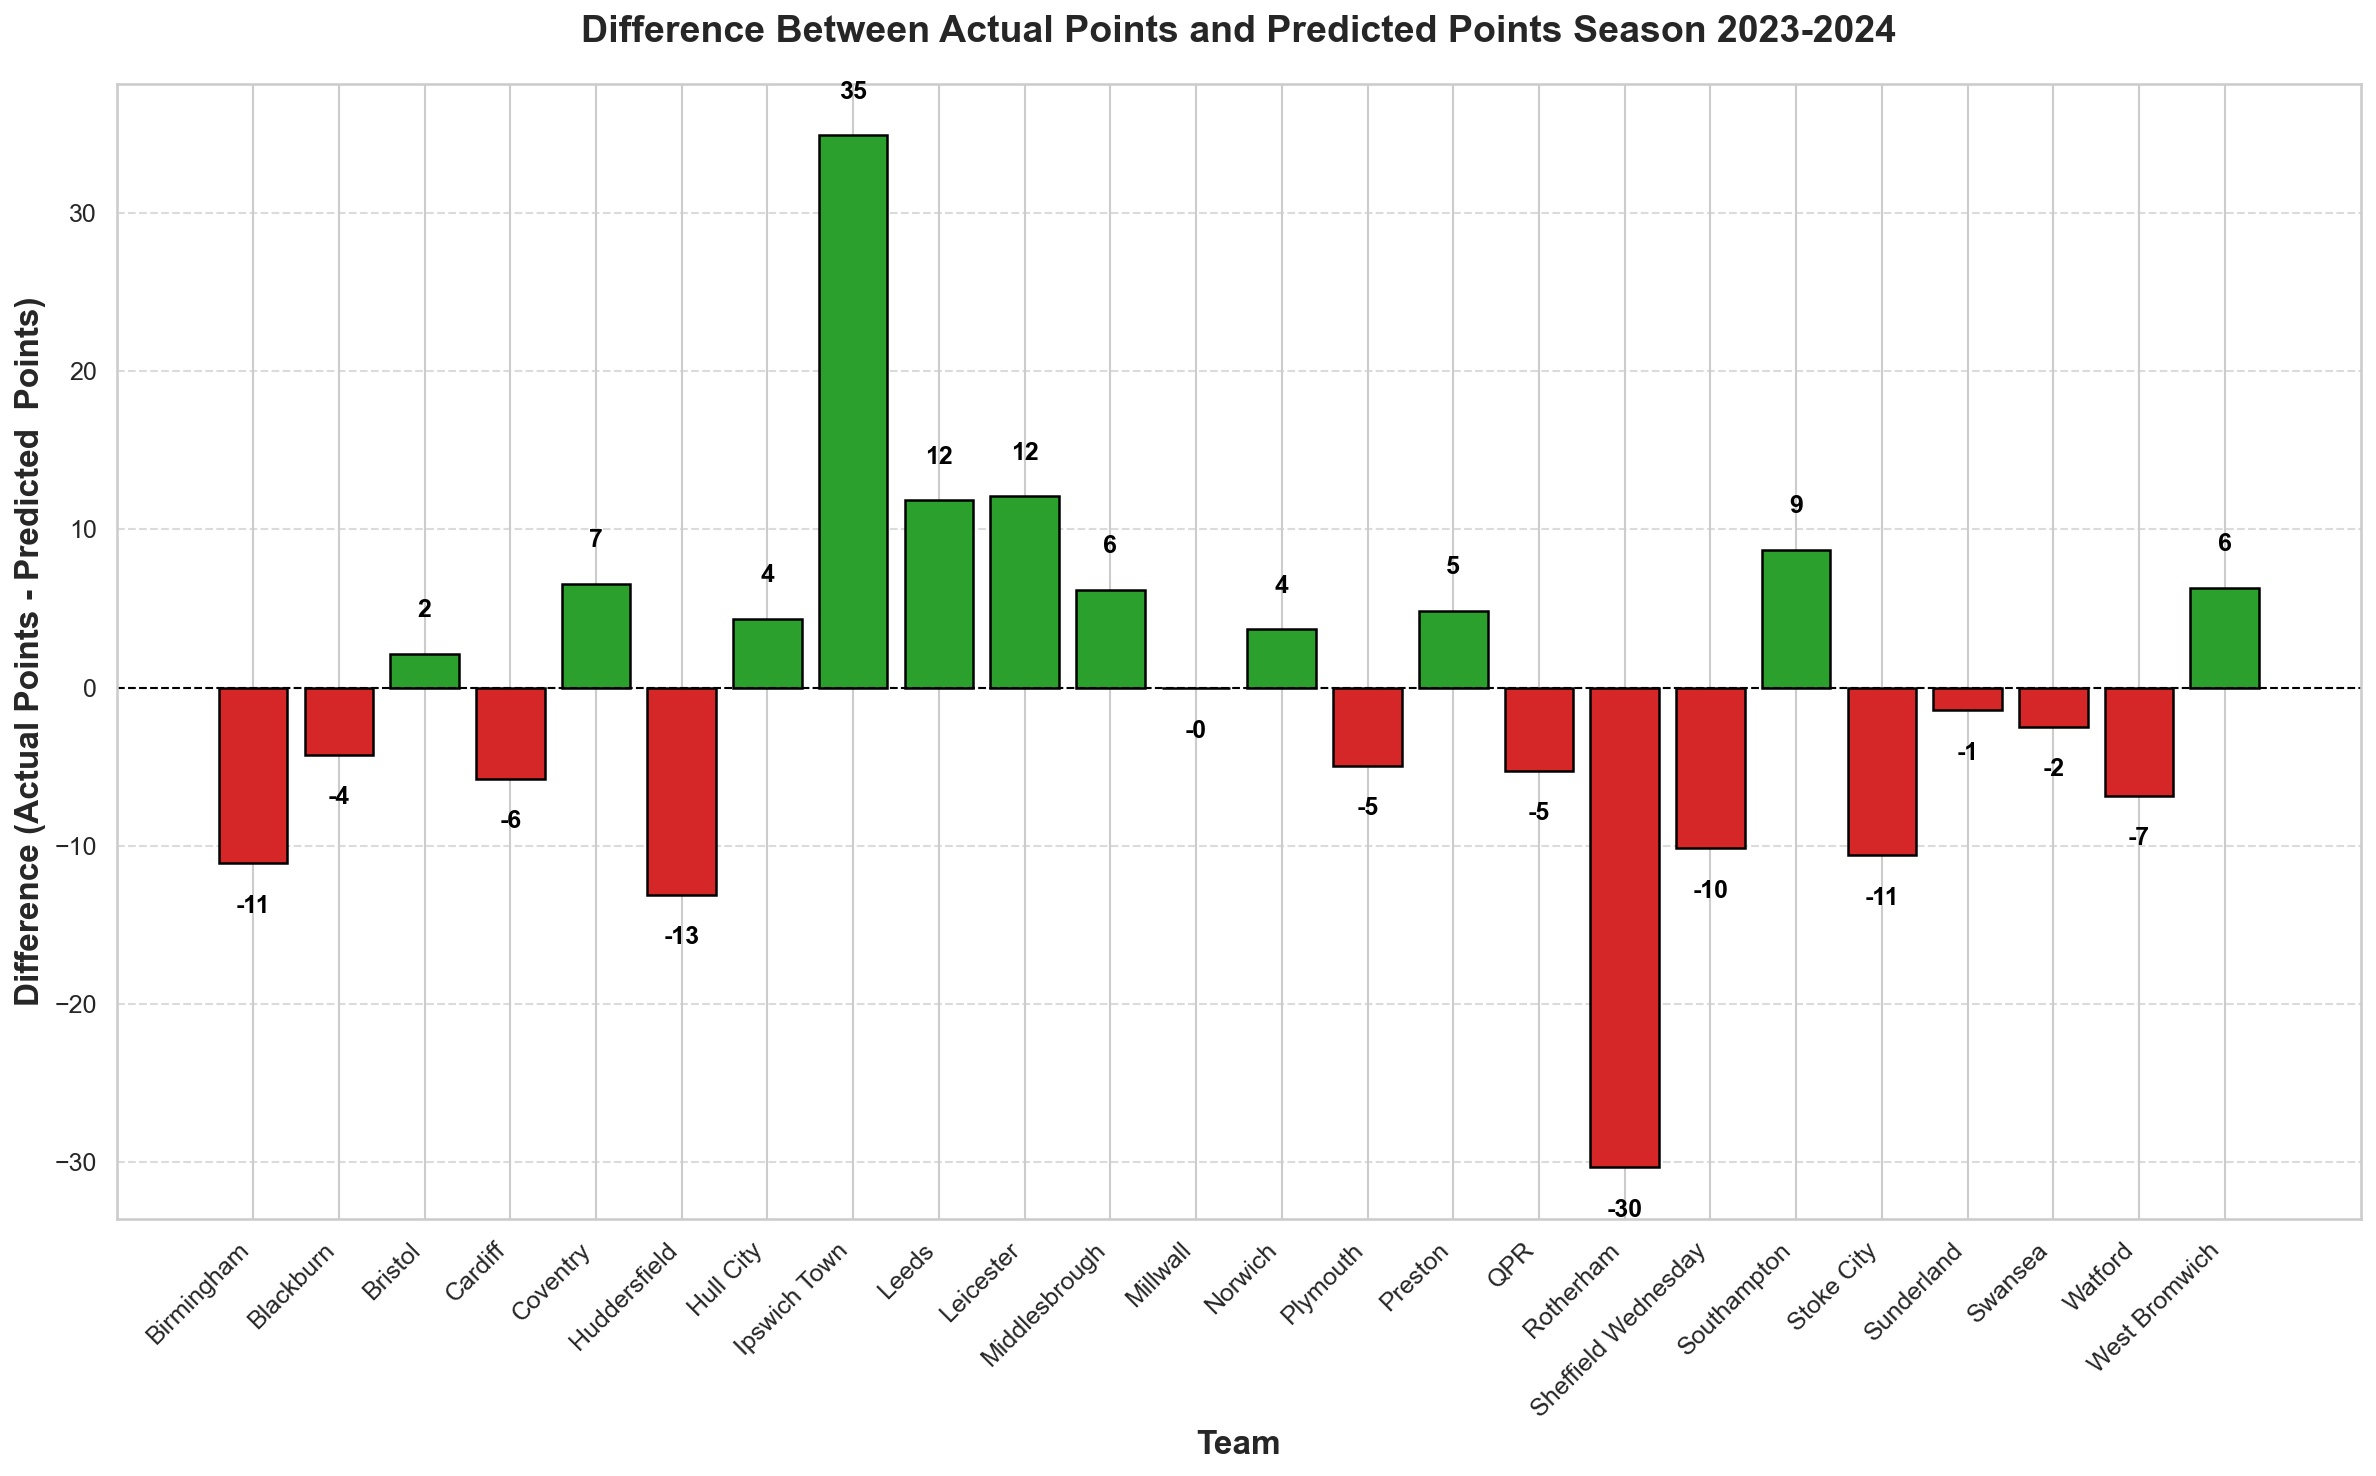
Most clubs in the Championship fall relatively close to the baseline expectation, with only a few notable outliers such as Ipswich Town and Rotherham. Ipswich significantly overperformed relative to their wage bill, while Rotherham underperformed, suggesting that the latter’s wage expenditure may not be yielding the expected returns.
Of course, numerous external factors influence these deviations such as injuries, tactical setups, managerial decisions, and squad depth all play significant roles. While these elements are beyond the scope of this analysis, the wage-to-points comparison provides a starting point for stakeholders to investigate further. In Rotherham’s case, for example, their wage bill might prompt deeper questions about inefficiencies in squad management or recruitment. Ultimately, while this approach is not a definitive measure of success, it offers a valuable lens through which clubs can assess their financial efficiency in relation to performance.
Season 2024-2025 Over and Under Performances
Premier League
Applying the same polynomial regression approach to the ongoing 2024-2025 season, we can now analyze wage expenditure relative to expected and actual points. With the majority of the season completed in both the Premier League and the Championship, league positions are beginning to solidify. The variability in potential finishing positions is narrowing, making this an opportune time to evaluate teams’ performances in relation to their wage bills. By estimating expected points based on wages and comparing them to actual standings, we can once again assess which teams are exceeding expectations and which are falling short.
In the Premier League, notable outliers emerge. Bournemouth and, of course, Liverpool projected to be champions have significantly overperformed relative to their wage expenditure, demonstrating remarkable efficiency in converting financial resources into results. On the other hand, several high-spending clubs, including Manchester United, Manchester City and even Southampton and Leicester, have underperformed based on their wage bills. While Manchester City remains in contention for a Champions League spot, they have not lived up to the performance levels suggested by their financial outlay and will fall short of a title challenge. This highlights the broader theme that, while wages are a strong predictor of success, they are not an absolute determinant
Championship
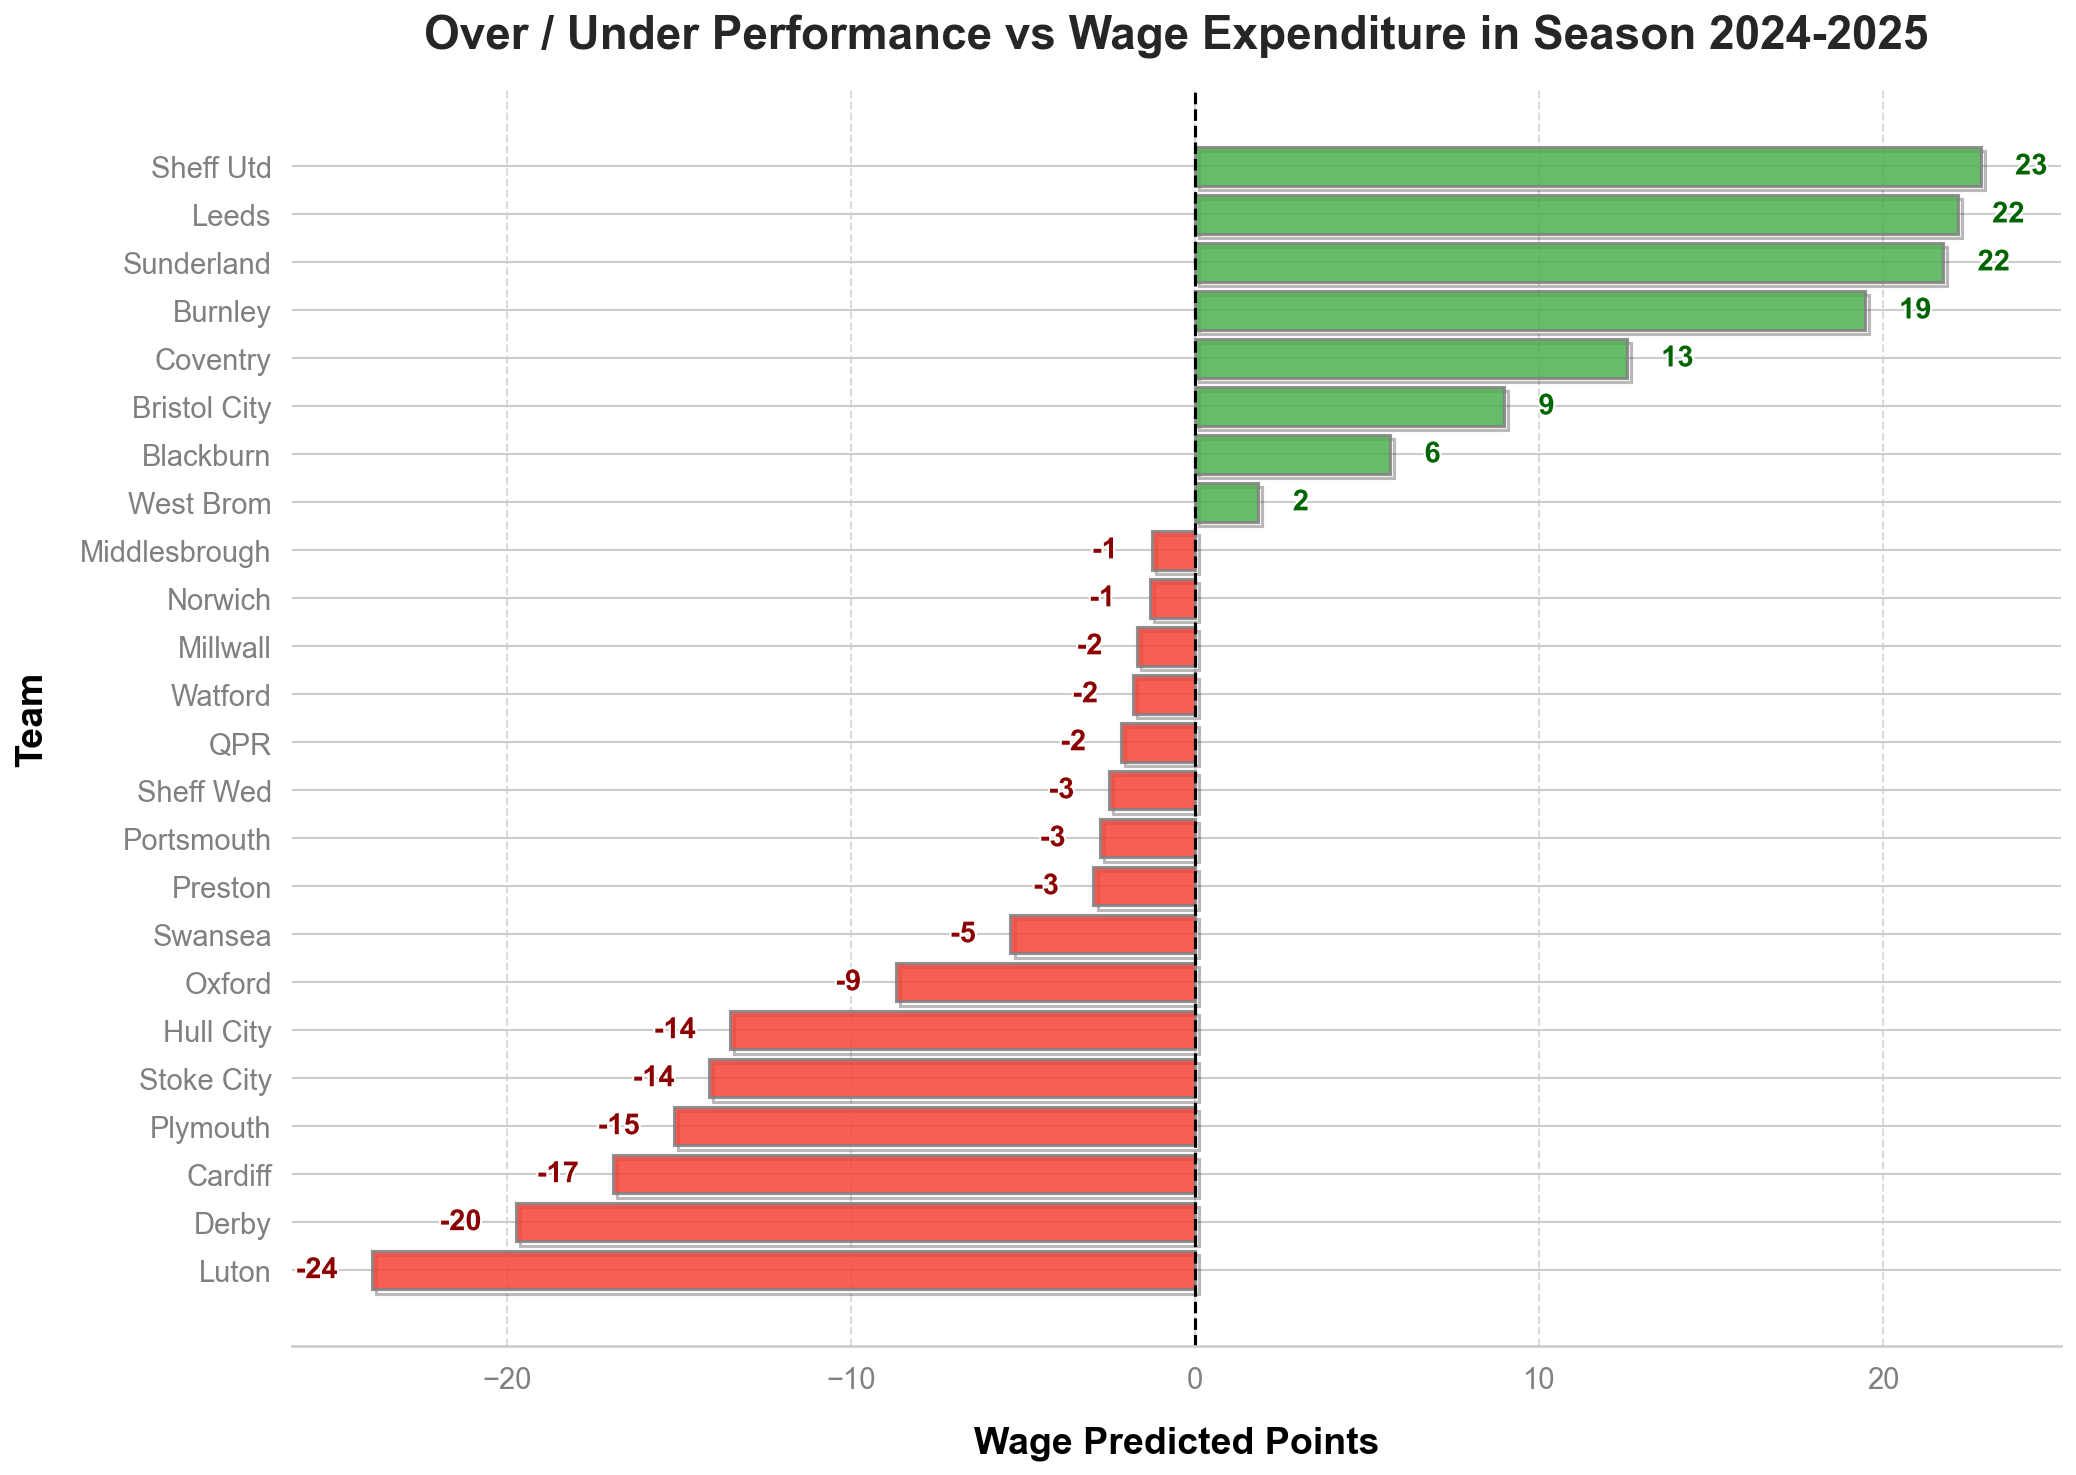
The Championship follows a similar trend in terms of approach, with some significant over- and underperformers. Sheffield United stands out as a team defying expectations, as they were not widely predicted to be in the promotion playoff spots at the start of the season, yet they find themselves in strong contention. On the flip side, Luton recently relegated from the Premier League has struggled to reassert itself, while Derby County finds itself in a shock relegation battle despite pre-season odds of 12-1 for a playoff finish. These cases reinforce the value of using wage expenditure as a benchmarking tool, even if not an absolute measure of success. For stakeholders, this analysis serves as a useful conversation starter, providing a structured way to assess whether a club’s financial outlay is delivering the expected return in terms of league position and points accumulation.
The Pareto Principle: Top 10 Highest Paid Players
The hypothesis underlying this analysis from this point on is anchored in the Pareto Principle, which suggests that approximately 80% of results typically come from 20% of causes. In the context of Premier League football, this translates to the expectation that a club’s performance is disproportionately influenced by a select group of high-earning, key players. Given a standard squad size of around 25 to 30 players, clubs allocate wages based on historical performance metrics, market constraints, and budgetary limitations, inevitably resulting in certain players receiving significantly higher wages. Under this framework, the core assumption is that if a club maximizes the minutes played by its ten highest-paid players, those who presumably deliver superior on-field value, then the overall team performance should markedly improve. Essentially, the investment in these top earners, if leveraged effectively through increased playing time, should yield stronger competitive outcomes, directly reflecting the principle that a small subset of players can disproportionately drive team success.
Leveraging the Pareto Principle for squad-building hinges on recognizing that a small cohort of top earners can disproportionately influence match outcomes. However, real-world complications abound. If one or two key players among these top earners sustain long-term injuries or if managerial change shifts tactics unfavourably for them clubs may struggle to realize their expected performance gains. Historical precedents, such as Leicester City’s improbable 2015–16 Premier League title, also demonstrate that collective synergy among mid-range earners can exceed the impact of one or two marquee players on large wages, even though retrospectively those players may have been underpaid in contrast to their careers since. Hence, while the data hint that maximizing minutes for high earners usually correlates with improved results, it cannot replace a holistic squad-building ethos that fosters overall balance, fitness, and motivation.
Motivating Example
Building on our hypothesis using the Pareto Principle, we examined the relationship between playing time and wages for the top 10 highest-paid players in each squad. The underlying assumption here is that the best-paid players are also the best performers, meaning that maximizing their playing time should, in theory, enhance a team’s capacity to accumulate points. Essentially, if a team’s highest earners are consistently on the pitch, their contribution should translate into better overall performance. This concept forms the foundation of our analysis, which seeks to determine whether teams are efficiently allocating playing time to their most valuable assets.
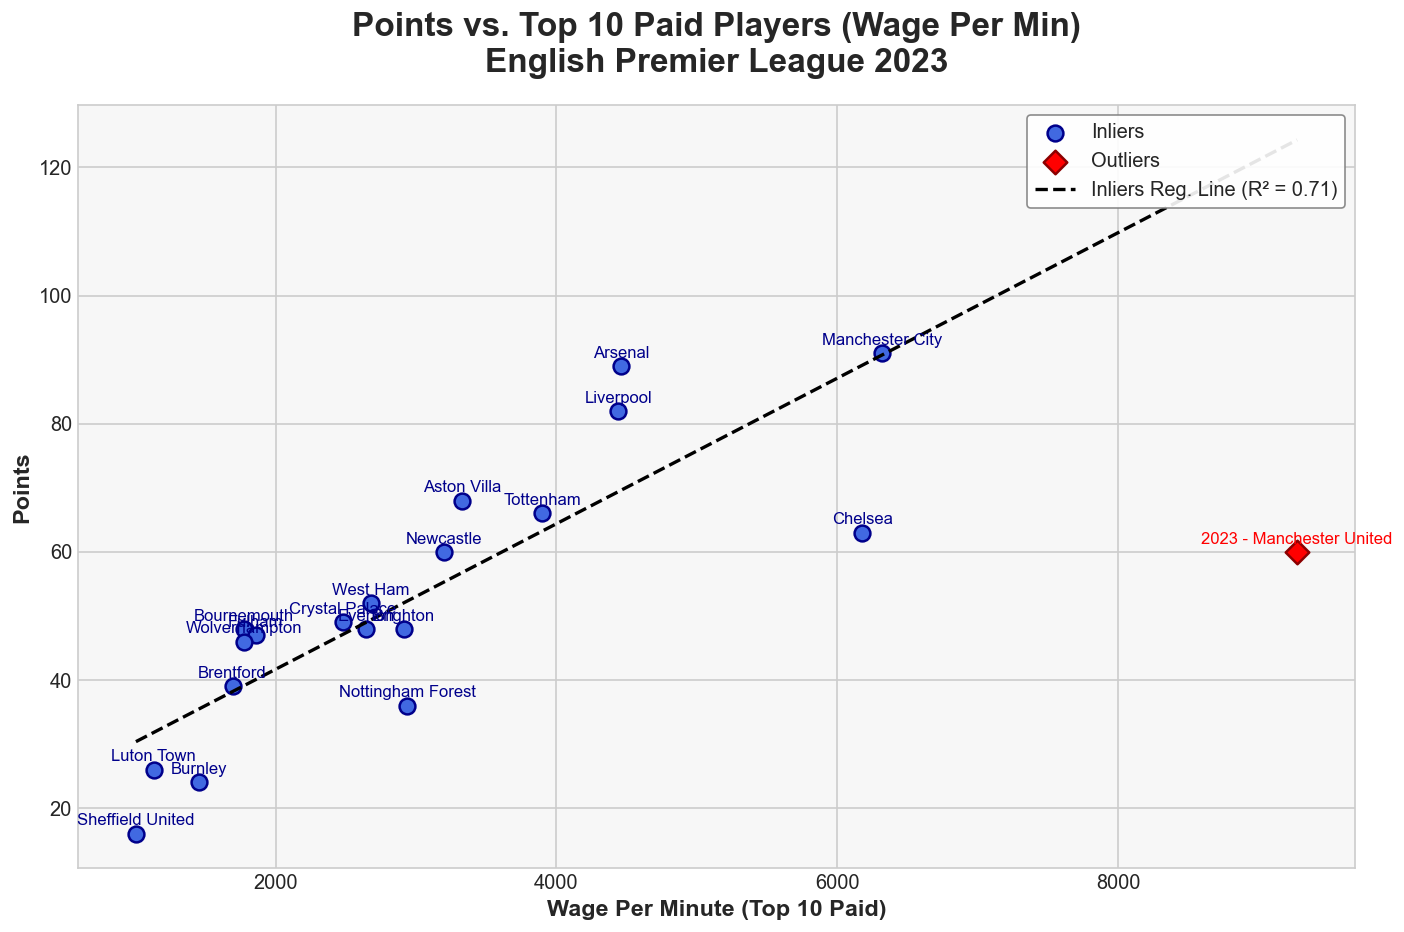
Looking at a practical example from the 2023-2024 Premier League season, we found a strong linear relationship between points and wage per minute a metric derived by dividing the total wages of a team’s top 10 highest-paid players by their total minutes played throughout the season. This simple measure offers a proxy for how effectively clubs are utilizing their financial resources in relation to game time. When plotted, this relationship produced an R-squared value of 0.7, indicating a strong correlation between points accumulation and the amount of playing time given to the top-paid players. However, one notable outlier in this analysis was Manchester United, a club that, despite significant wage investment, did not translate financial spending into on-field success. This aligns with broader trends seen in recent years, where Manchester United’s wage structure and performance have often been disconnected an issue that warrants deeper exploration in a separate analysis.
Despite this outlier, the broader findings suggest that this approach has merit. The motivating example reinforces the idea that clubs should closely monitor the playing time of their highest-paid players as a potential key driver of success. By applying the Pareto Principle, teams can assess whether they are getting sufficient "bang for their buck" from their wage expenditures. If a club can ensure that its top earners are on the pitch as much as possible assuming they maintain fitness and form it should theoretically maximize its points accumulation potential. This method provides a structured way for clubs to evaluate wage efficiency and optimize squad management decisions in pursuit of better performance.
Premier League
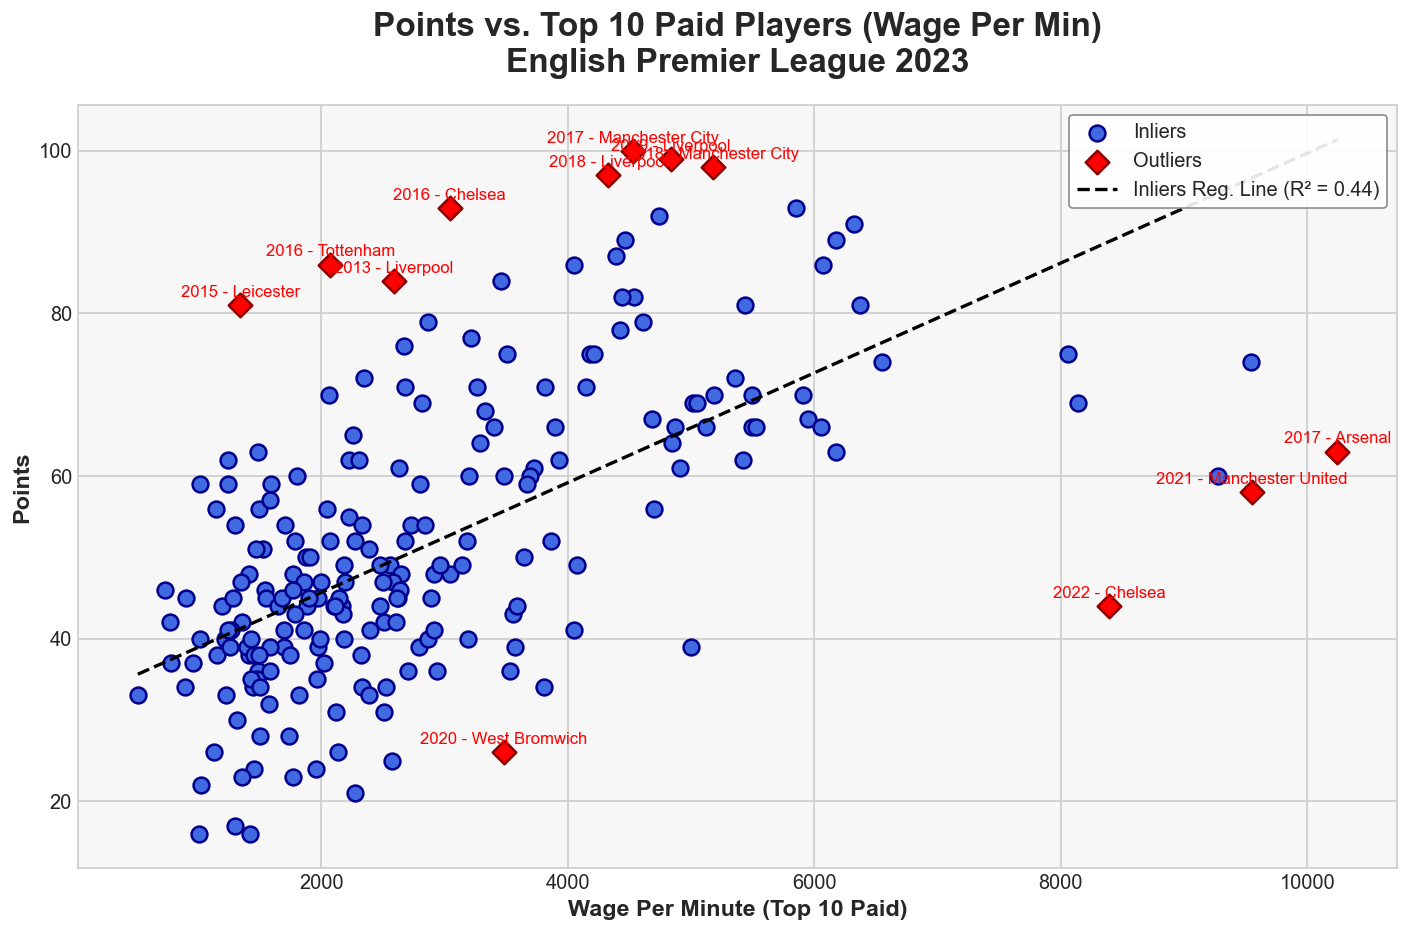
By analyzing the wage per minute of the top 10 highest-paid players and their corresponding points accumulation, particularly in the Premier League across the last 10 Seasons, we observe a reasonably strong linear relationship. The regression model highlights clear outliers, pinpointed in red, such as Manchester United and Chelsea in 2022, where performance did not align with wage expectations. These cases naturally invite further discussion narratives can be constructed around their extreme inefficiencies. However, for the majority of clubs, the relationship between wage expenditure and points remains well-structured, reinforcing the predictive power of financial investment in squad strength.
This approach offers an effective, data-driven tool for stakeholders a one-stop overview to assess the expected return on investment in a club’s top 10 highest-paid players. Given that these players often represent the most substantial financial commitment in a club’s wage structure, understanding their impact on performance is essential for decision-making in recruitment, squad management, and financial planning.
The marginal effect of wage per minute on points is relatively small but measurable. Starting with an initial wage per minute of 5000, the model predicts an expected points total of 65.94. With each 1% increase in wage, the predicted points rise incrementally based on the linear relationship. For example, at a 10% increase in wage (5500 per minute), the model predicts 69.31 points, reflecting a steady but modest increase. The relationship remains linear, meaning that each additional percentage increase in wage contributes the same absolute increase in points (approximately 0.34 points per 1% wage increase). However, unlike the log-log model, where percentage changes have a fixed proportional effect, the impact here remains constant in absolute terms but varies in percentage terms depending on the wage level. At a 20% increase in wage (6000 per minute), the predicted points reach 72.69, illustrating how higher spending on wages correlates with improved performance, albeit with no guarantee as there is evidence of diminishing returns.
Championship
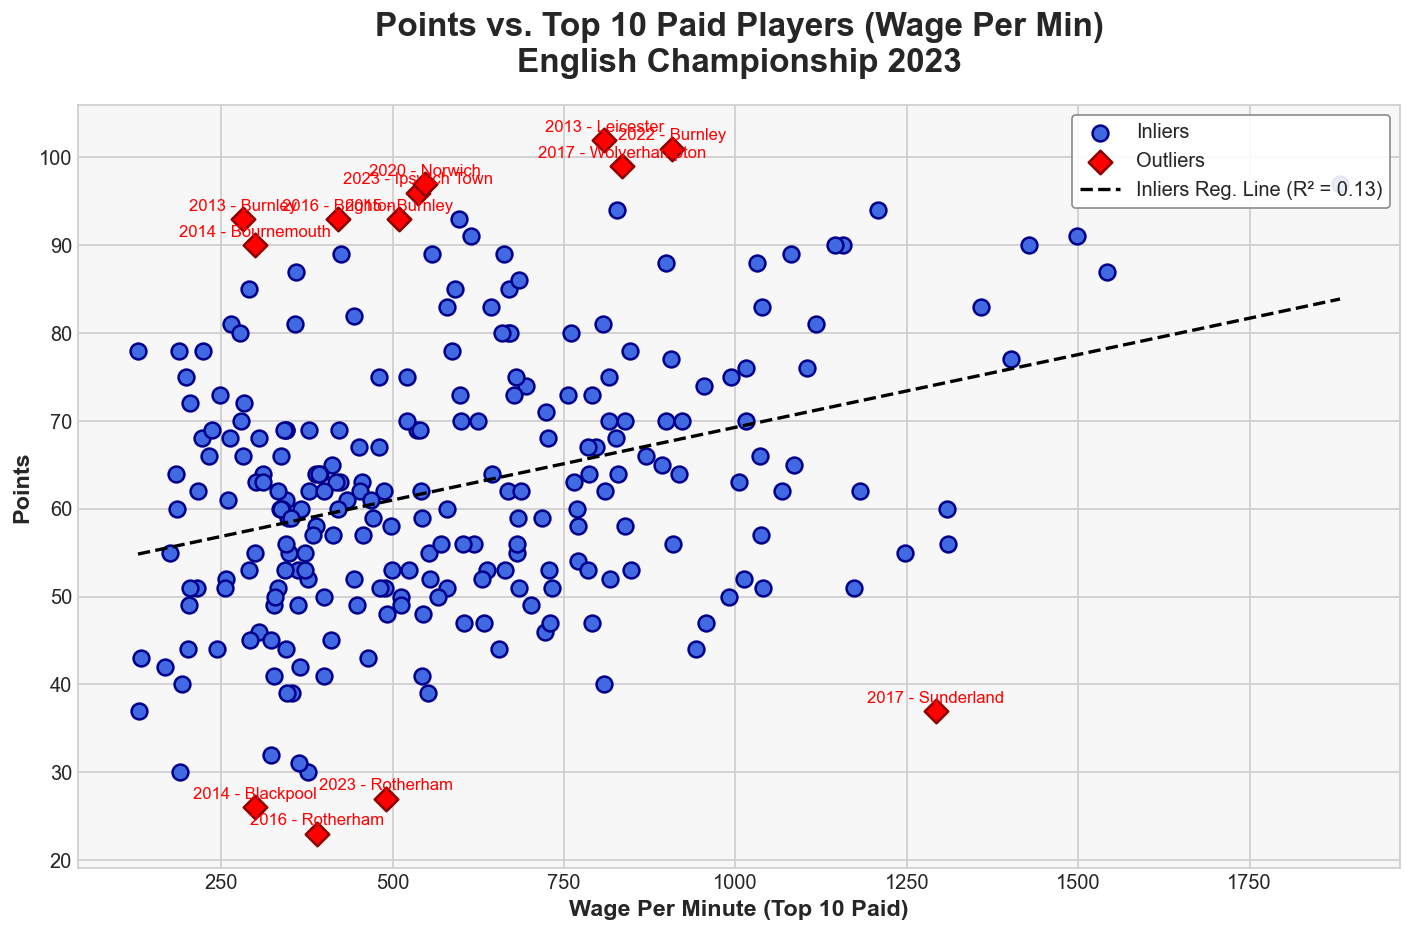
When analyzing the Championship, the linear regression relationship between wage per minute and points accumulation is significantly weaker compared to the Premier League. While there is still a positive relationship meaning that an increase in wage per minute for the top 10 highest-paid players does, in theory, lead to higher points it is a much weaker effect. This suggests that many other factors influence success in the Championship beyond just wage expenditure. Unlike the Premier League, where financial power is a stronger predictor of performance, the Championship presents greater variance in points accumulation, indicating a more complex competitive landscape.
The marginal effect of increasing wage per minute on points is notably weaker compared to the Premier League. The R² value of 0.133 indicates that wage expenditure explains only a small portion of the variance in points accumulation. The slope of 0.017 suggests that a 1% increase in wage leads to only a 0.017% increase in points a very modest return on investment
Starting with an initial wage per minute of 500, the model predicts an expected points total of 62.19. Since the relationship remains linear, each 1% increase in wage per minute results in a fixed absolute increase in points, although the effect is relatively minor compared to the Premier League.
For example:
- A 10% increase in wage per minute (550 per minute) results in a predicted points total of 62.93, a small but steady rise.
- At a 20% increase (600 per minute), the model predicts 63.62 points, further reinforcing the marginal impact of wage growth on success.
- A 50% increase in wage (750 per minute) only raises expected points to 65.42, demonstrating the diminishing return on investment at higher wage levels.
- Even at a 100% increase in wages (1000 per minute), the model predicts only 67.82 points, showing that simply increasing wages is not a guaranteed path to dominance.
Disclaimer
This article does not claim that wage bill is the sole determinant of success especially in a league like the Championship, where financial structures are less extreme and more compressed. Several key dynamics help explain why wage expenditure has less predictive power in this division:
- Closer wage distribution: Most Championship clubs operate within a relatively narrow wage range, reducing the financial gap between teams.
- Parachute payments: Relegated teams receive financial support from the Premier League, creating temporary financial disparities that do not always translate into immediate on-field dominance.
- Fixture congestion & squad depth: The 46-game season, coupled with additional cup competitions, increases the physical and tactical demands on squads, making factors like squad rotation, injuries, and managerial approach more impactful than in a shorter, more financially stratified league like the Premier League.
Despite these complexities, analyzing wage expenditure still provides a useful benchmarking tool. While not a determinant of success, it remains a yardstick for financial health and sustainability, helping clubs manage their budgets without overspending or underspending. Furthermore, by examining the marginal effects assessing the return on investment for each additional increment in wage expenditure clubs can still extract valuable insights into how efficiently their wage bill translates into on-field performance.
The Impact of Wage Per Minute and Minutes Played Across the Premier League and Championship
By extending the analysis beyond wage per minute (wagePerMins) alone, we introduce pure minutes played (mins) for the top 10 highest-paid players to assess how much plain playing time of top 10 best paid players impacts overall points accumulation. We look at it in a very simple OLS MLR. This approach allows for a bigger picture evaluation of how clubs extract value from their most expensive assets, recognizing that maximizing minutes played enhances a player's influence while also affecting the cost efficiency of wage spending.
The correlation matrix and VIF values (~1.06) remain consistent across both leagues, reinforcing that minutes and wage per minute provide independent value in predicting points. However, in the Premier League, the impact of minutes played is even more pronounced, reflecting the reality that elite talent must be consistently available and utilized for teams to succeed.
Premier League Findings
The Premier League presents a much stronger relationship between wage per minute, minutes played, and points accumulation. The R² value of 0.551 indicates that 55.1% of the variance in points is explained by these two factors, a significant jump from the Championship. This highlights the greater financial disparity between clubs in the Premier League, where wage spending plays a more dominant role in determining success.
- Minutes Played (Coefficient = 0.003): Every additional minute played by a club’s top 10 highest-paid players increases the club’s expected points by 0.003 points, which is stronger than in the Championship.
- Wage Per Minute (Coefficient = 0.006): Every additional unit increase in wage per minute contributes 0.006 points still meaningful, but a lower coefficient than in the Championship, likely due to the higher baseline level of talent and squad quality in the Premier League.
Championship Findings
In the Championship, the multiple regression model suggests that both wage per minute and minutes played contribute to points accumulation, but with a relatively weak relationship (R² = 0.244). This means that only 24.4% of the variance in points is explained by these two factors, suggesting that many other variables, such as squad depth, tactical setup, injuries, and external conditions like fixture congestion, play a significant role.
- Minutes Played (Coefficient = 0.002): Every additional minute played by the top 10 highest-paid players increases the club’s expected points by 0.002 points.
- Wage Per Minute (Coefficient = 0.021): Each additional unit increase in wage per minute contributes 0.021 points, reinforcing the idea that financial investment is still relevant, though less so than in the Premier League.
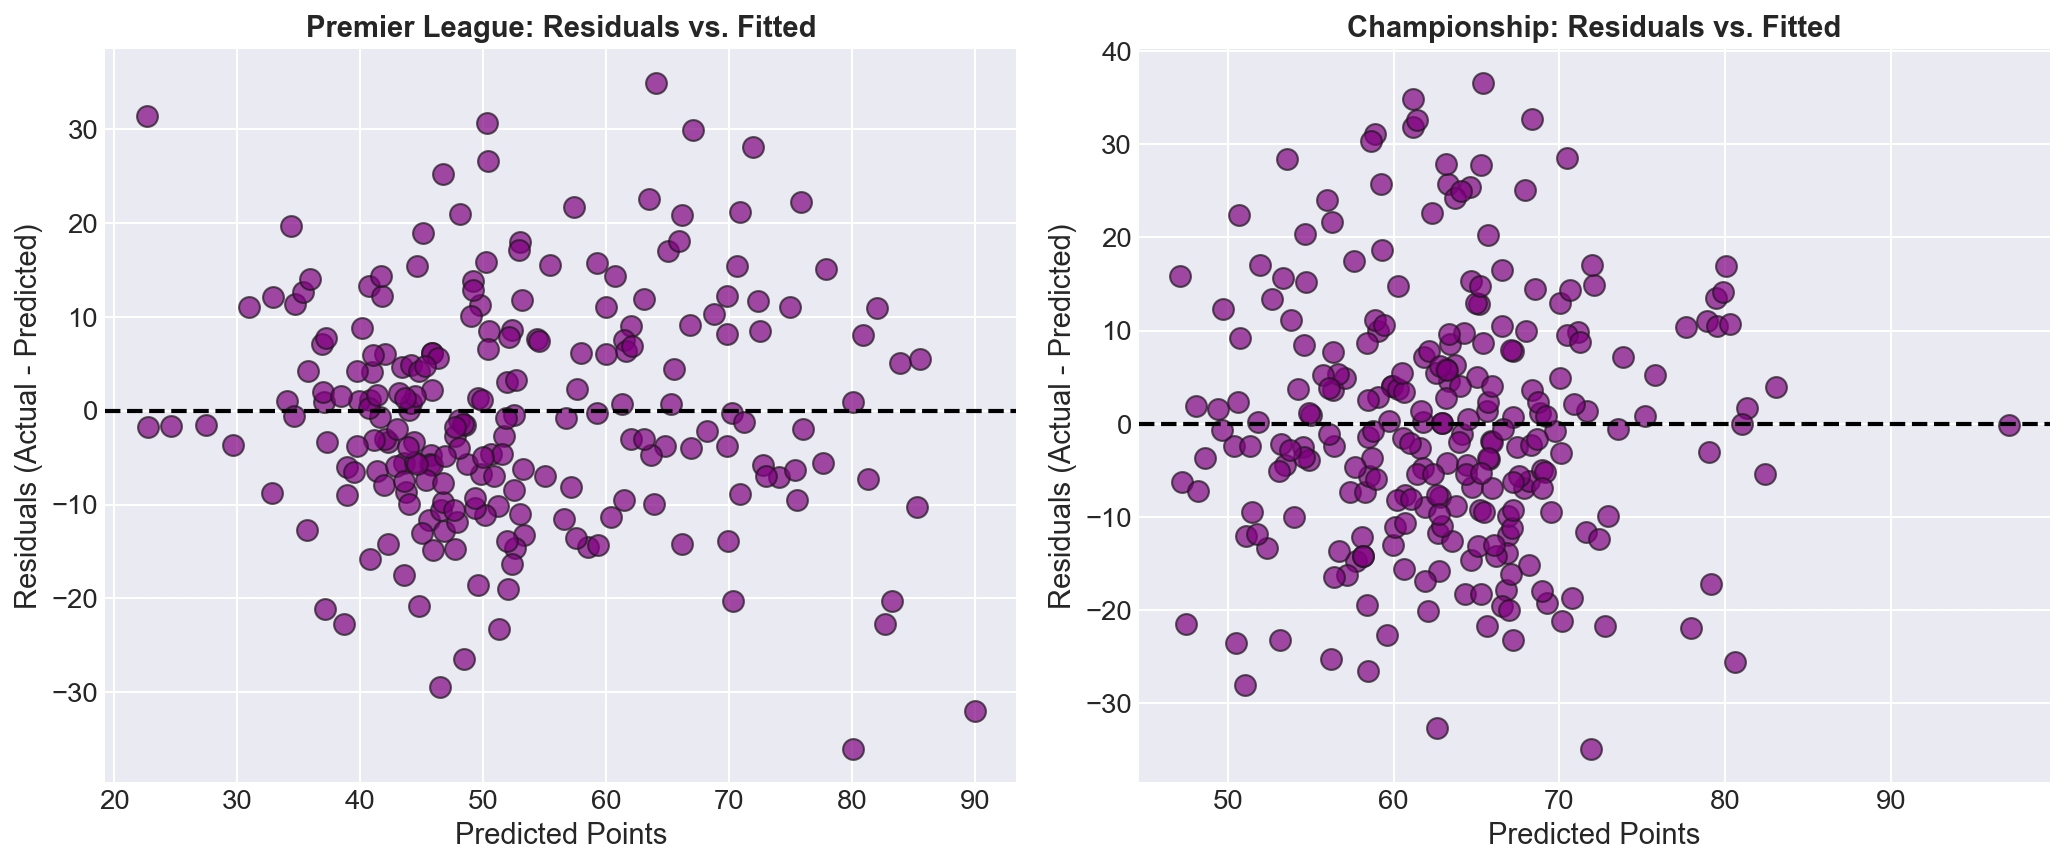
Residuals vs. Fitted Plots: Interpretation
The residual plots compare actual vs. predicted points to assess how well the models fit the data for both leagues.
- Premier League (Left Plot):
- Residuals are more tightly clustered around zero, indicating a better model fit.
- However, variance increases at higher predicted points, suggesting the model struggles with elite teams.
- Championship (Right Plot):
- Residuals are more widely spread, showing greater prediction errors.
- This suggests that wages and minutes explain less of the variation in points, reinforcing the unpredictability of the Championship.
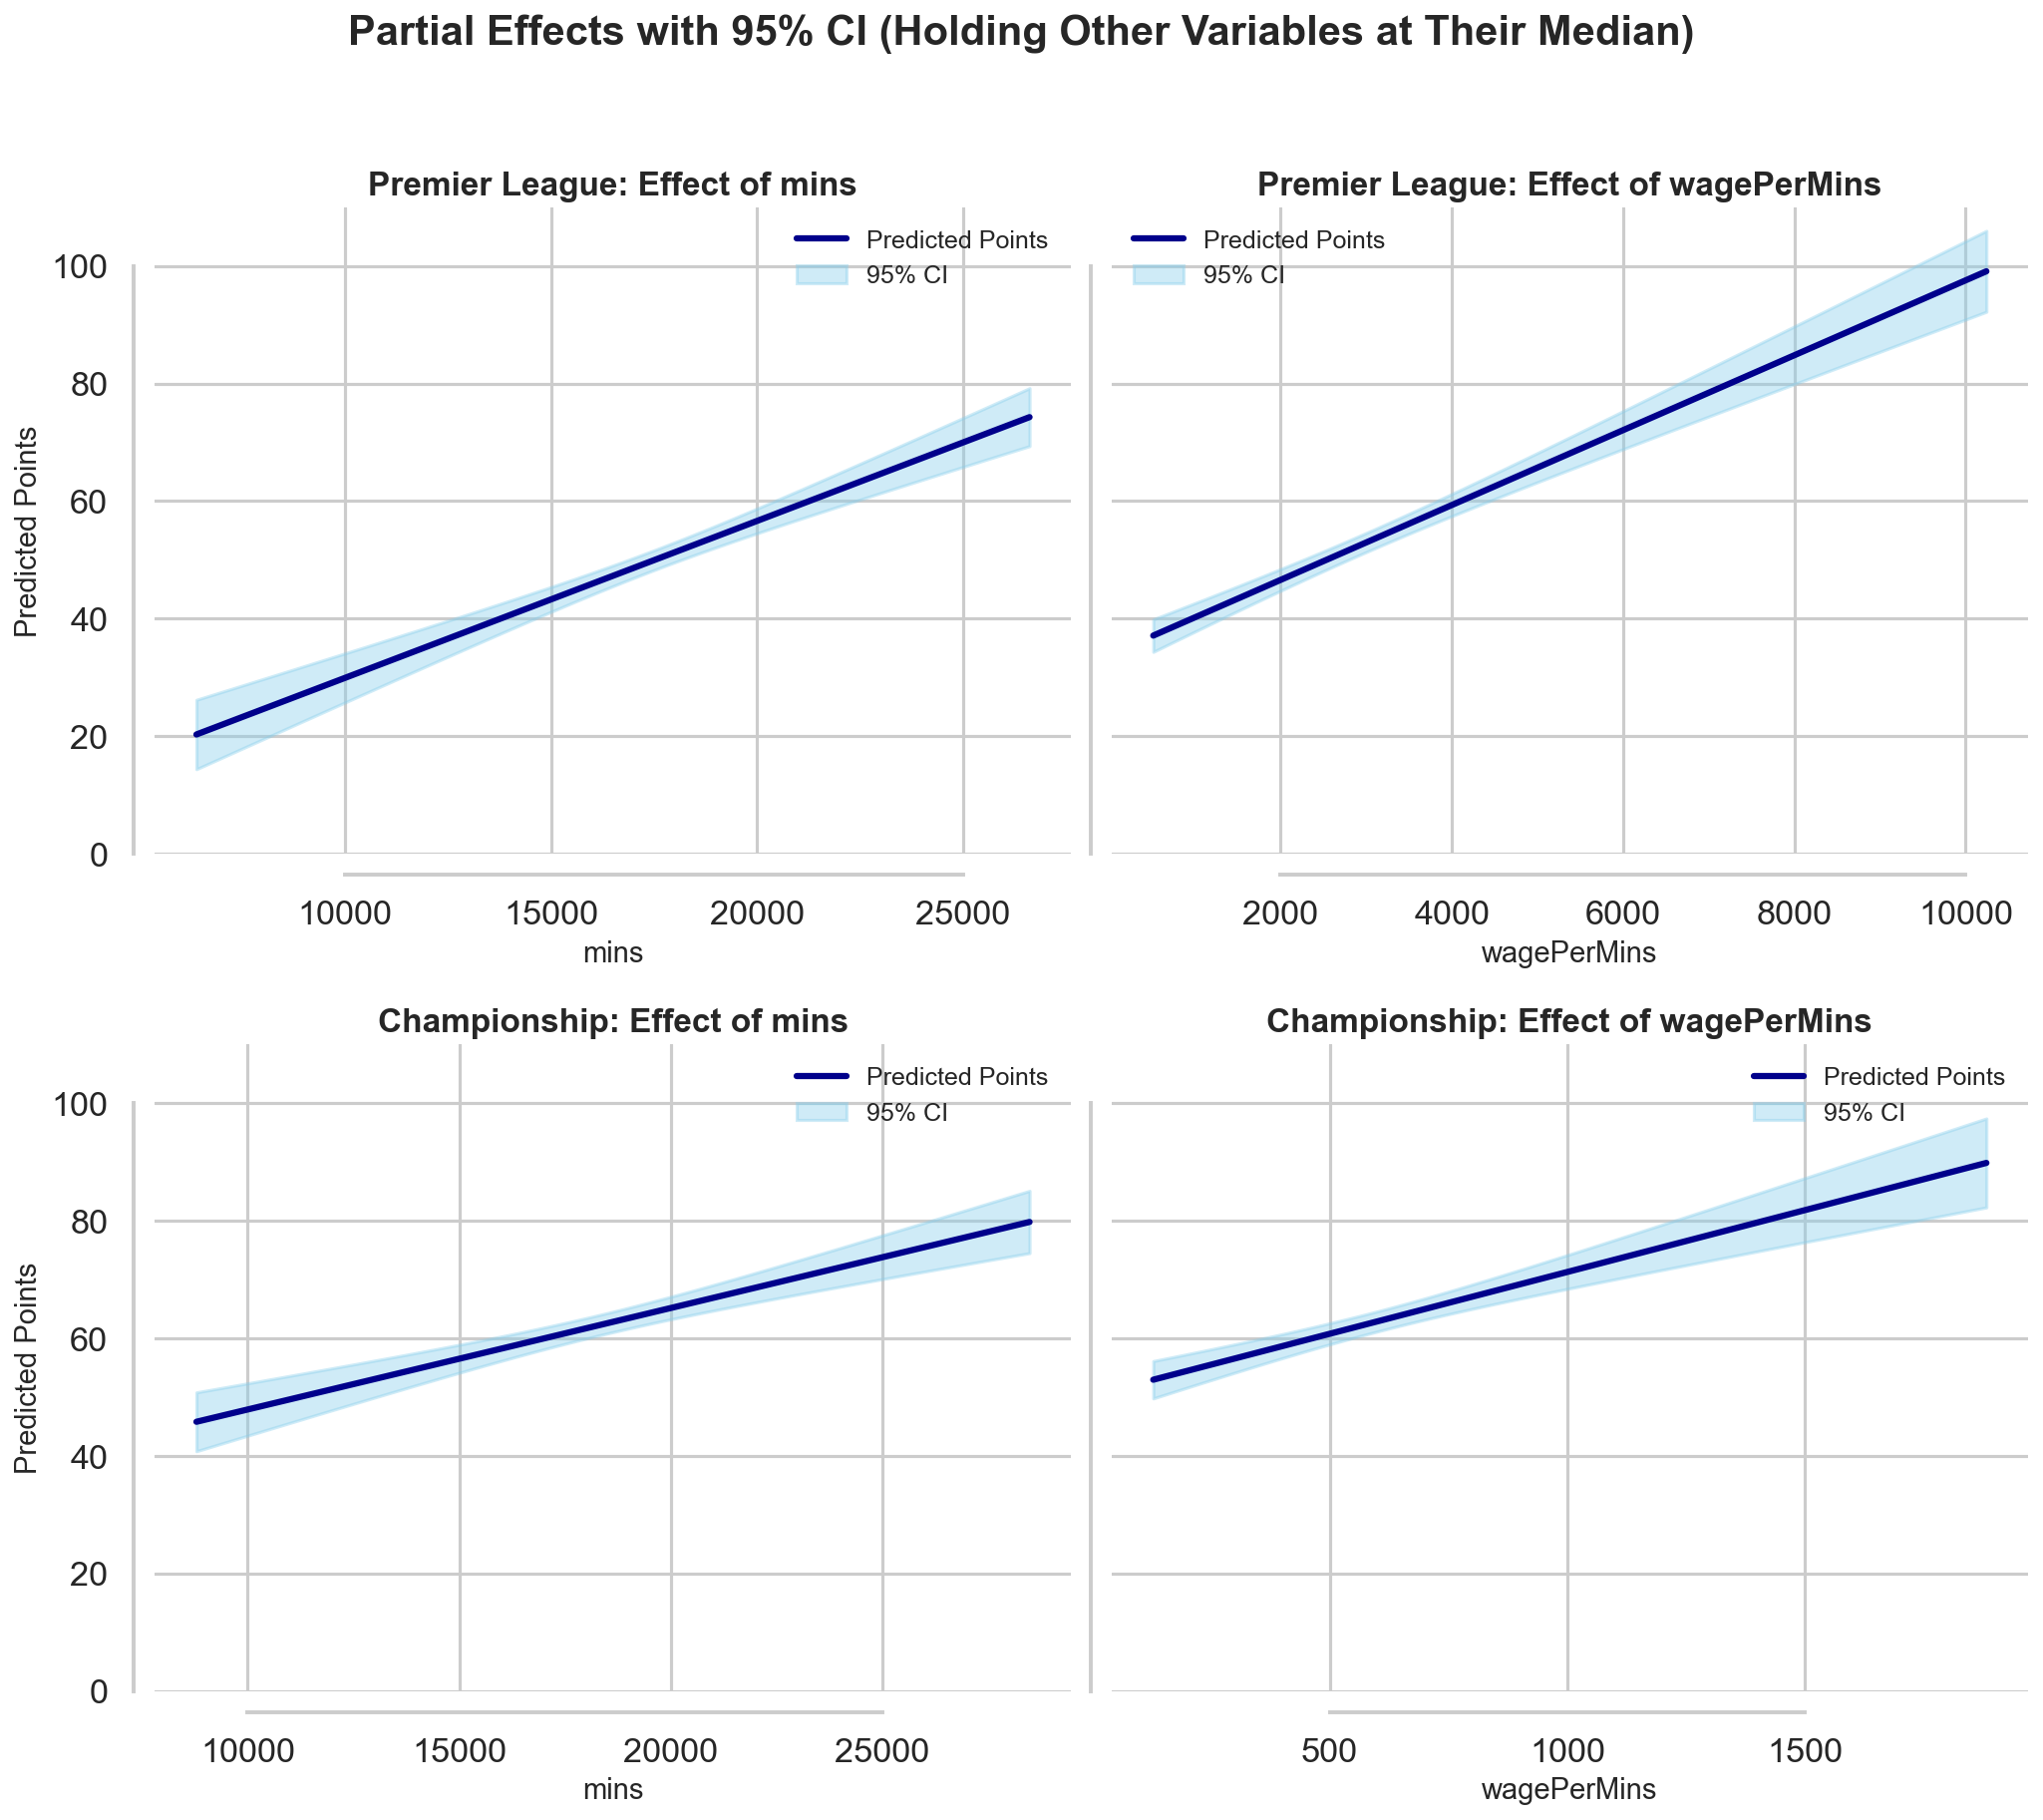
Explanation of Partial Effects Plots
The partial effects plots show how changes in minutes played and wage per minute affect predicted points while keeping the other variable at its median level. These graphs illustrate the marginal effect of each predictor on expected performance.
Premier League (Top Two Plots)
- Effect of Minutes Played (Top Left)
- As minutes played increases, predicted points increase steadily, indicating that giving more game time to the highest-paid players has a consistent positive effect on league performance.
- The narrow confidence interval (CI) suggests that this effect is relatively stable across different teams.
- Effect of Wage Per Minute (Top Right)
- Higher wage per minute is also associated with more points, but the effect appears slightly weaker than that of minutes played.
- The confidence interval is wider at higher wage levels, suggesting that teams with extremely high wage bills experience more variance in their performance returns.
Championship (Bottom Two Plots)
- Effect of Minutes Played (Bottom Left)
- The trend is similar to the Premier League, where increasing minutes played improves predicted points.
- However, the confidence interval is slightly wider, reflecting greater variability in how minutes played translates to success in the Championship.
- Effect of Wage Per Minute (Bottom Right)
- The impact of wage per minute is much weaker compared to the Premier League.
- The confidence interval is wider than in the Premier League, reinforcing that wage spending does not consistently predict success in the Championship.
The Takeaways
This analysis demonstrates that while wage expenditure and minutes played are useful indicators of team success, their predictive power varies significantly between leagues. In the Premier League, there is a strong and consistent relationship between higher wage per minute, more playing time for top earners, and improved points accumulation supporting the notion that financial investment, when aligned with effective player utilization, yields competitive advantage. In contrast, the Championship presents a more volatile landscape: wage effects are weaker, and success is influenced by a broader mix of tactical, managerial, and structural factors. For clubs operating in either league, this study highlights the importance of not just spending, but spending wisely optimizing game time for top earners, benchmarking wage efficiency, and recognizing the diminishing returns of excessive outlay. Ultimately, it offers stakeholders a practical lens to evaluate whether they are truly getting "bang for their buck" from their wage bill.
Summary
- 💷 In the Premier League, a 1% increase in wage per minute (top 10 paid players) yields an average ~0.34-point increase, demonstrating a measurable return especially when paired with consistent playing time.
- 📉 In the Championship, that return drops to just ~0.017 points per 1% wage increase, showing that wages alone are a much weaker predictor of success in a more tactically variable and unpredictable environment.
- ⏱️ Minutes played by top-paid players is a key driver of performance. Clubs must ensure their highest earners are both worthy of their salaries and consistently on the pitch. Maximising the availability and usage of these players enhances return on investment and ensures spending isn't wasted on underutilised assets.
- 📊 Wage distribution differs massively by tier: Premier League wage bills range from ~£30 million to over £300 million, while most Championship clubs cluster between £10–60 million flattening the wage-performance curve and contributing to a weaker correlation.
- ✅ Wages won’t win you the league, but tracking wage efficiency is a powerful performance barometer helping clubs align financial outlay with contribution, manage risk, and ensure they’re getting proper bang for their buck.