Game Strategy | MANAGEMENT in Rugby Union: A Statistical Approach

Rugby Union is celebrated for its unique blend of physicality, strategy, and precision. Historically, tactical decisions in rugby have relied on intuition and experience. However, the integration of data science has introduced a transformative lens, enabling a deeper understanding of game dynamics. This article explores the evolving role of game strategy in Rugby Union, with a particular focus on how probabilistic analysis and decision-making can influence outcomes during critical moments.
The Importance of Data-Driven Game Strategy
Strategic decision-making in rugby often centers on pivotal moments, such as whether to kick for touch, aim for goal, or opt for a quick tap. These decisions, while seemingly tactical, carry profound implications for the game’s trajectory. By analyzing how each scoring opportunity contributes to the probability of winning, teams can develop more precise strategies.
A key question underpins this approach: How does the timing and choice of action affect the probability of winning or losing a match? Answering this question bridges the gap between tradition and innovation in rugby strategy.
Methodology
Data Collection
To ground our analysis in empirical evidence, we examined two decades of international rugby data. This dataset included scoring timelines, capturing the sequence and timing of tries, conversions, and penalties. By aggregating these instances across hundreds of matches, we established robust scoring probabilities.
Probabilistic Analysis
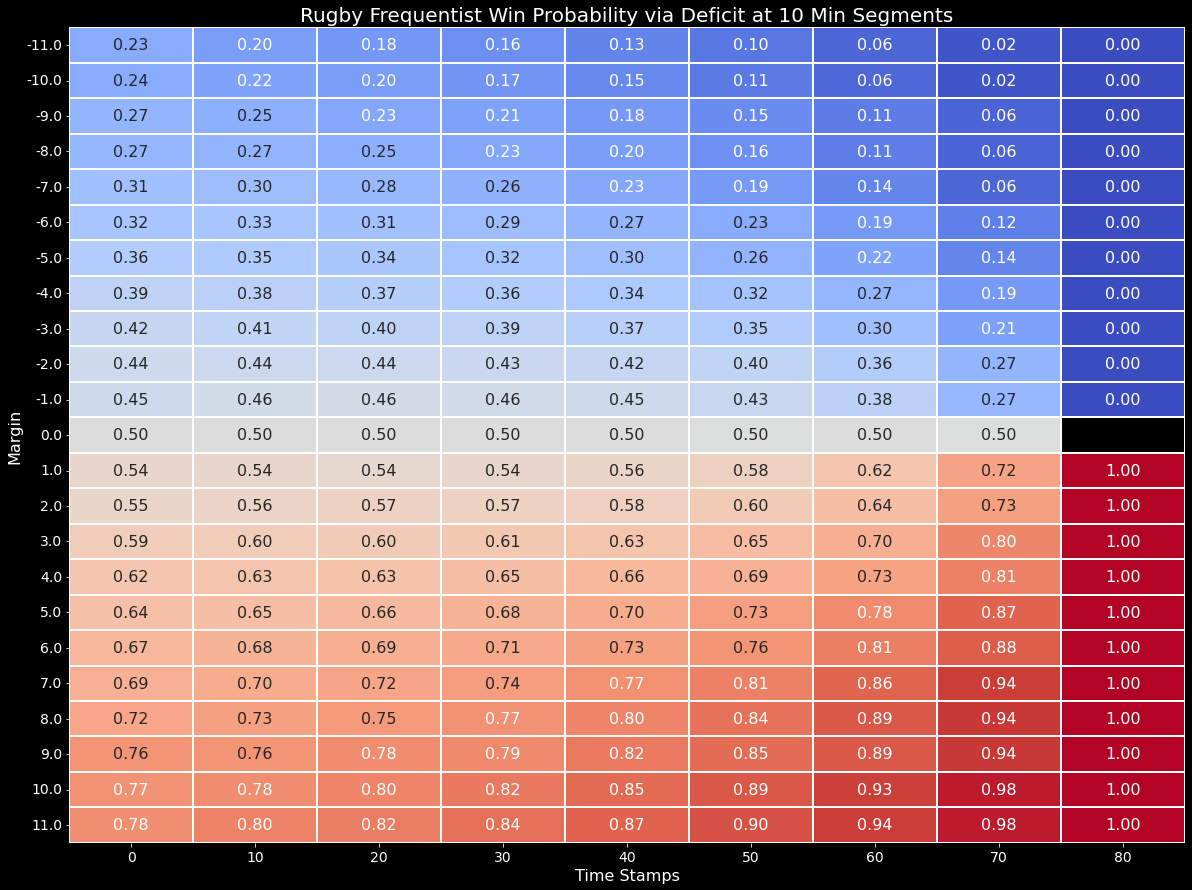
Using the data, we calculated the likelihood of scoring at different game intervals. These probabilities served as the foundation for our simulations, enabling a detailed exploration of various game scenarios.
Monte Carlo Simulations
Monte Carlo simulations were deployed to model a wide range of match scenarios. By running 100,000 simulations and segmenting the game into minute intervals, we calculated the probability of winning based on different scoring scenarios. This approach allowed us to evaluate how deficits, leads, and scoring opportunities influence match outcomes.
Team Ratings
In developing the Invenio model, we accounted for the attacking and defensive qualities of each team, considering their performances both at home and away. These ratings form a critical component of the model, directly influencing the initial game win probability at the start of the match. As the game progresses, these ratings interact with real-time events, such as scoring and game minutes, to dynamically adjust the probability of winning. This comprehensive approach ensures that our model reflects the inherent strengths and weaknesses of each team in various scenarios.
Scoring Rate Modelling
A fundamental aspect of the Invenio model is the incorporation of scoring rate data. Through extensive analysis, we identified scoring rates for penalties, converted tries, and non-converted tries for each team. These metrics serve as a cornerstone of our modelling framework, capturing the unique scoring characteristics of teams and their ability to convert opportunities into points. By integrating these scoring rates, our model is better equipped to simulate realistic game scenarios and provide accurate probability estimates throughout the match. This data-driven approach ensures that the model's assumptions are firmly grounded in the realities of team performance.
Results and Key Insights
Timing and Win Probability
Our analysis revealed several critical insights:
- Impact of Early Scores: Each point scored in the first 30 minutes increased the probability of winning by approximately 3%.
- Significance of the Final 20 Minutes: The largest shifts in win probability occurred during the last quarter of the game, where a stagnant score line, if trailing, could significantly diminish chances of a comeback.
- Penalty vs. Try Decisions: In the final 20 minutes, opting for a penalty kick when trailing by seven points reduced the loss probability by up to 13%. Conversely, attempting a try and failing almost guaranteed defeat.
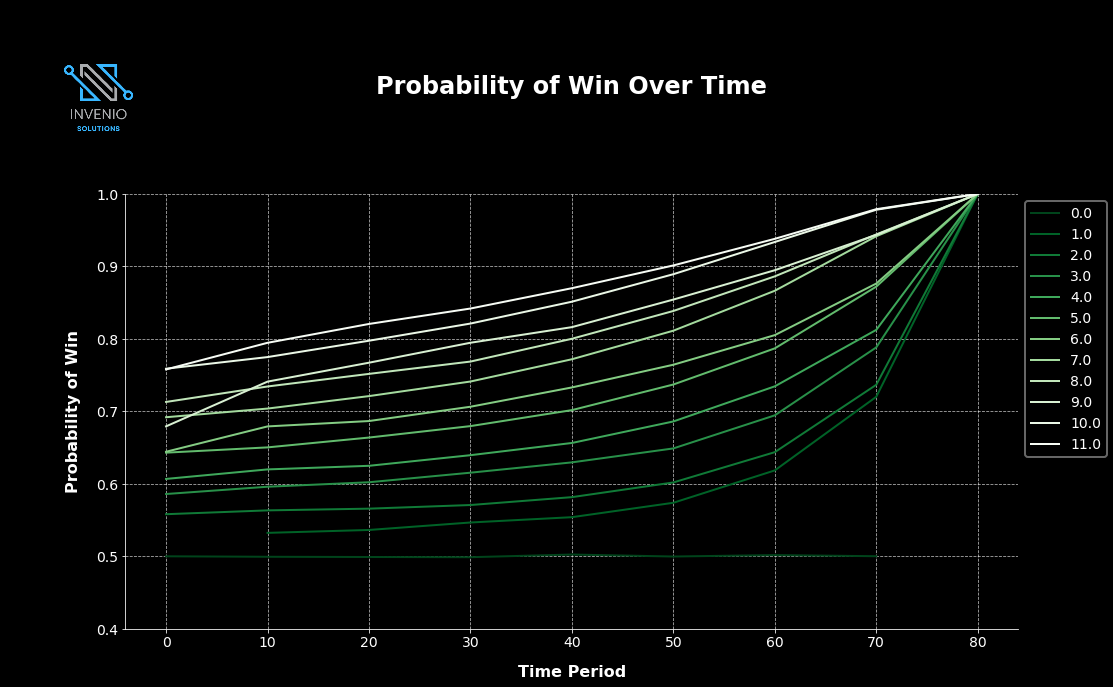
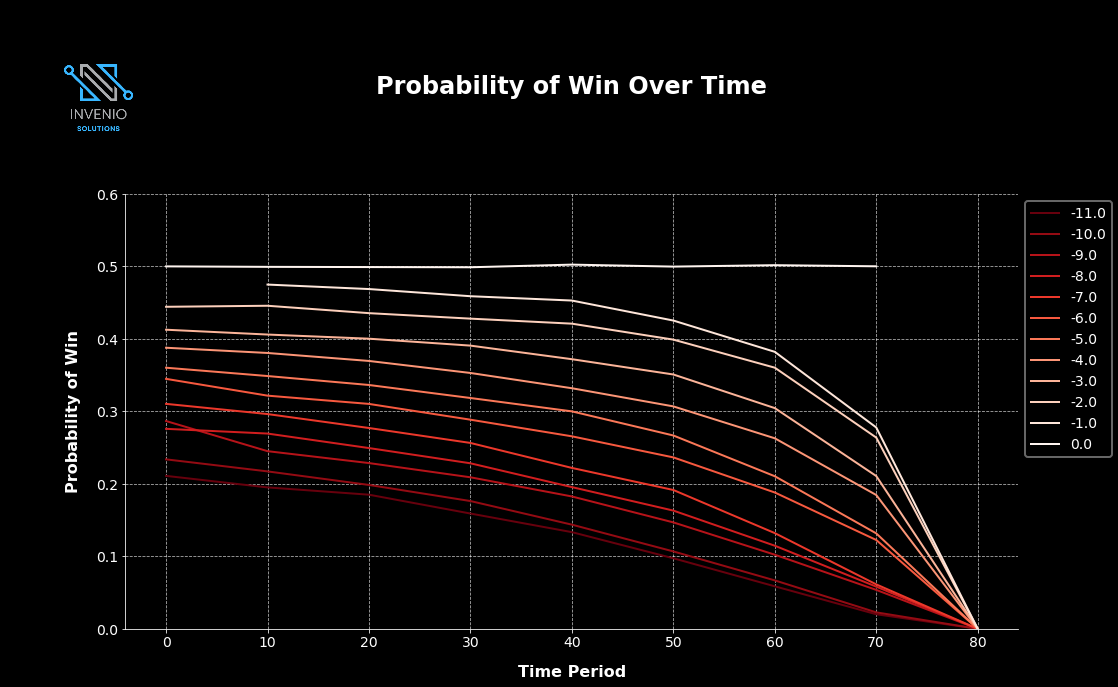
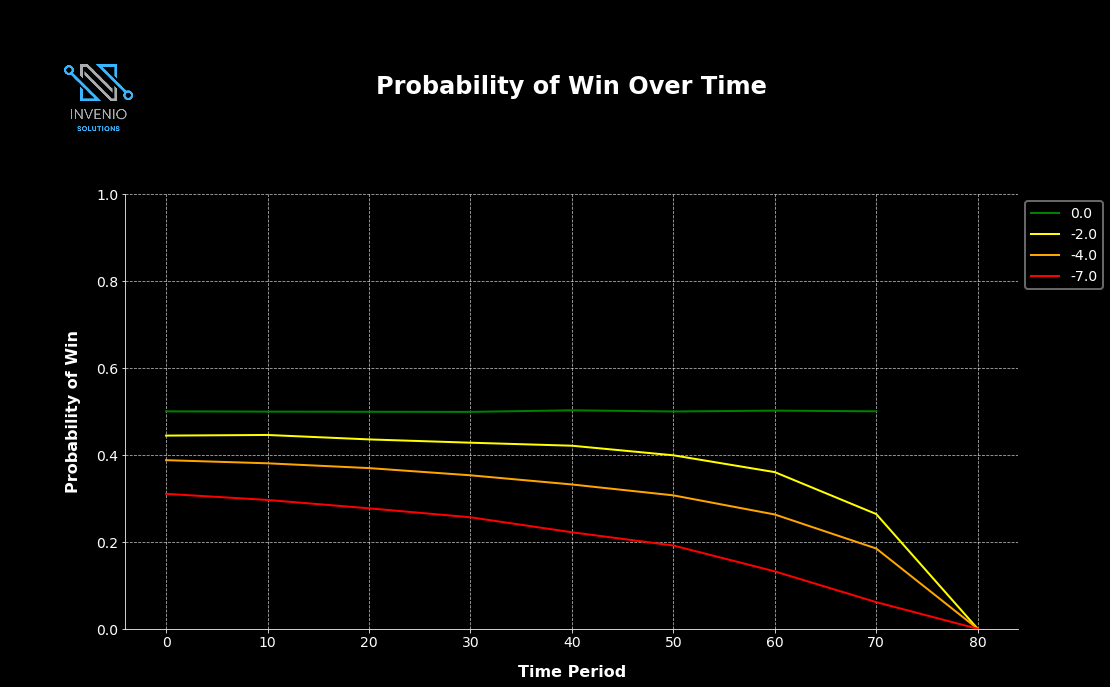
Visualizing Win Probabilities
To better illustrate these dynamics, we created visual models demonstrating how win probabilities fluctuate over time. These models highlight the critical nature of timing and decision-making, particularly in high-stakes moments.
A Crucial Scenario: The Penalty Dilemma
Setting the Stage
Imagine your team is trailing by seven points with 30 minutes left in the match. The current win probability stands at 20%. A penalty is awarded, presenting a critical decision point:
- Kick for Goal (3 Points): Reduces the deficit and increases win probability by extending the game’s timeline.
- Kick for Touch: Prioritizes field position and the potential for a try but carries the risk of no score.
Analysis of Outcomes
- Penalty Kick: A successful kick narrows the deficit to four points and maintains momentum. It extends the timeline for further scoring opportunities, a critical factor in comeback scenarios.
- Kick for Touch: While offering a chance at a try, failure to capitalize significantly reduces the win probability, often dropping it below 10%.
Future Considerations for Evolving this Model
Scoring and Conceding Distributions
Analysing when and where teams are most likely to score or concede points can refine in-game tactics. For example, if a team excels defensively in the final minutes, opting for a try rather than a penalty could exploit a tiring opposition.
Penalty Frequency
Tracking penalty trends offers actionable insights. High penalty counts can lead to sin bins, drastically impacting outcomes. Teams must balance aggressive play with discipline to optimize their chances.
Gain Line Probabilities
Understanding probabilities associated with gain line breaks at different field locations can inform offensive strategies. Teams can position players and structure attacks to maximize territorial advantage and scoring opportunities.
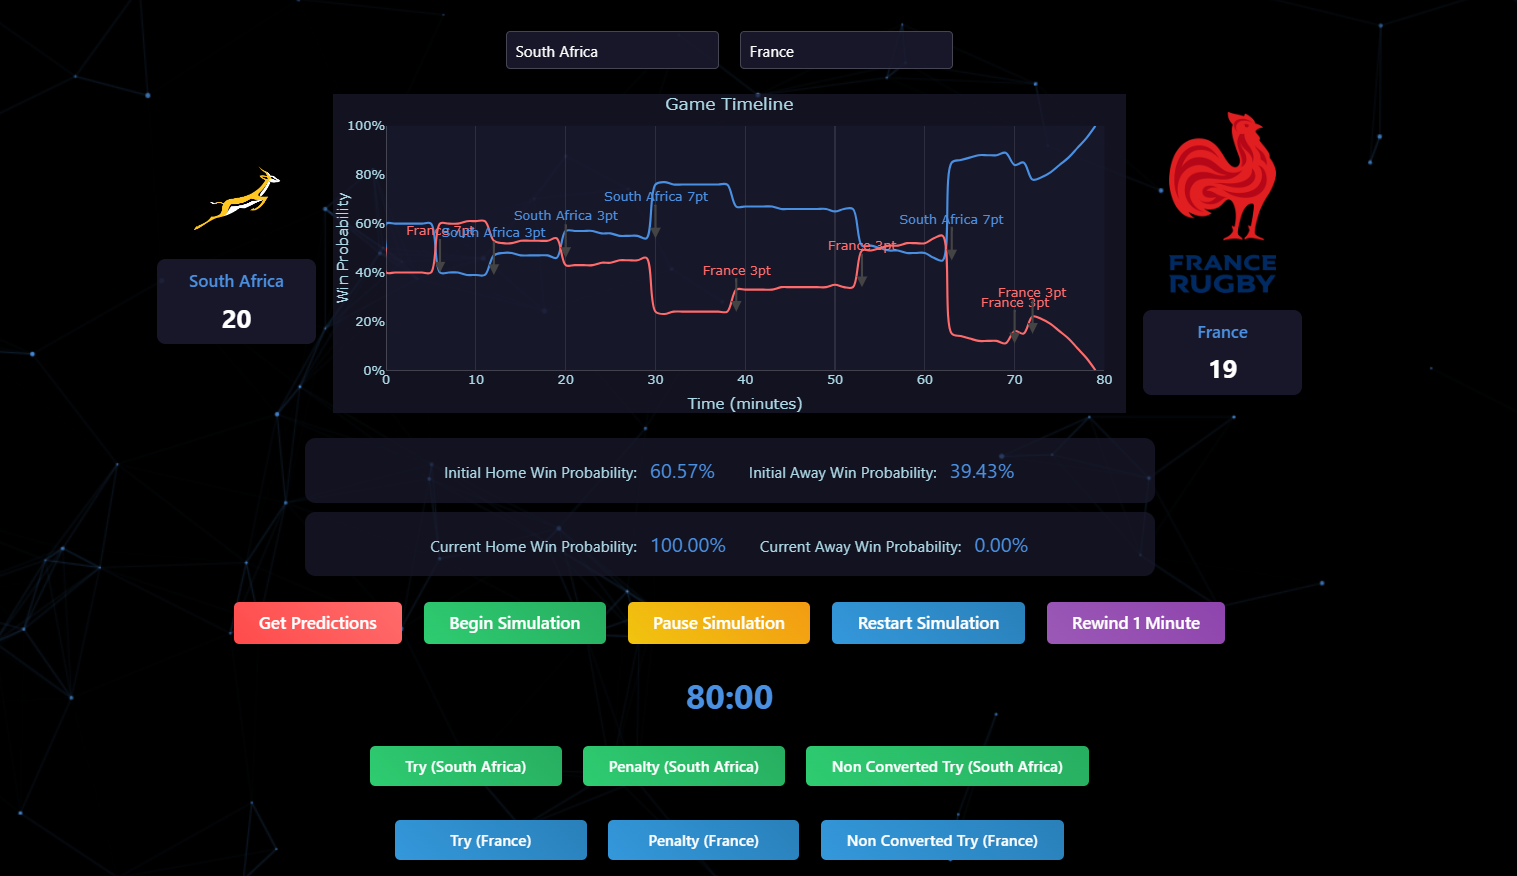
Introducing the Invenio Model
To put theory into practice, we have developed the Invenio Rugby Prediction Model, a dynamic tool that estimates win probabilities for international rugby games. The model is designed to integrate real-time match data, including score differences, game timeline, and team-specific ratings, to deliver accurate probability updates. Users can explore game scenarios, simulate outcomes, and better understand the impact of tactical decisions.
Visit the Invenio Model Page to explore how this tool is transforming the way we approach rugby strategy.